bulletin | feature story
Bolstering domestic supply chains remains a focus of US policy
By Lisa McDonald
In a continuation from 2021, the U.S. government again spent 2022 advancing efforts to strengthen domestic supply chains, as described in the annual United States Geological Survey Mineral Commodity Summaries report.1
The Mineral Commodity Summaries report spotlights events, trends, and issues from last year in the nonfuel mineral industry. Every August, the ACerS Bulletin overviews some of the key facts covered in the report, including statistics on production, supply, and overall market for a selection of minerals and raw materials used in the ceramics and glass industry.
In 2022, consumption for many mineral commodities began to approach or exceed pre-pandemic (COVID-19) levels. In the United States, the estimated total value of nonfuel mineral production increased by 4% from 2021 to $98.2 billion. The total value of industrial minerals production increased as well, by 10% to $63.5 billion. Of this total, $31.4 billion came from construction aggregates production. Crushed stone accounted for the largest share of total U.S. nonfuel mineral production value in 2022 with 21%.
For the metals sector, several metals experienced reduced production due to reduced ore grades and weather-related issues. On the other hand, for the industrial minerals sector, increased construction and materials for energy and infrastructure projects as well as other manufacturing sectors led to increased production value.
The ongoing Russian invasion of Ukraine, which started in February 2022, disrupted mineral supply chains last year. For example, prior to the conflict, Ukraine was the leading source of titanium mineral concentrates supplying Russia’s titanium metal industry. Following the invasion, major European and U.S. aerospace consumers of titanium have had to seek alternative supply sources.

ADVERTISEMENT
For the metals sector, several metals experienced reduced production due to reduced ore grades and weather-related issues. On the other hand, for the industrial minerals sector, increased construction and materials for energy and infrastructure projects as well as other manufacturing sectors led to increased production value.
The ongoing Russian invasion of Ukraine, which started in February 2022, disrupted mineral supply chains last year. For example, prior to the conflict, Ukraine was the leading source of titanium mineral concentrates supplying Russia’s titanium metal industry. Following the invasion, major European and U.S. aerospace consumers of titanium have had to seek alternative supply sources.
In February 2022, the U.S. Geological Survey published the “2022 Final List of Critical Minerals.”2 This list, which revised the one published in 2018, increased the number of critical mineral commodities and mineral groups from 35 to 50. This change was due to the addition of nickel and zinc; listing out individual platinum-group metals and rare-earth elements; and the removal of helium, potash, rhenium, strontium, and uranium.
Even with these changes, the U.S.’s reliance on foreign sources for raw and processed mineral materials remained clear. In 2022, the U.S. was 100% net import reliant for 12 critical minerals and was more than 50% net import reliant for an additional 31 commodities. Recycling provided the only source of domestic supply for antimony, bismuth, chromium, germanium, tin, tungsten, and vanadium.
As in 2021, the U.S. government spent 2022 strengthening not only critical mineral supply chains but also domestic supply chains identified as areas of focus in Executive Order 14017.3 On the Executive Branch side, President Joe Biden signed a presidential determination in March requiring the use of DPA title III authorities to strengthen the U.S. industrial base for large-capacity batteries,4 specifically by increasing domestic mining and processing of critical battery materials. In October, Biden announced the launch of the “American Battery Materials Initiative,”5 which will mobilize the entire government in securing a reliable and sustainable supply of critical minerals used for power, electricity, and electric vehicles.
Congress also took action on supply chains by passing two major pieces of legislation in August. The CHIPS and Science Act of 2022 provides $280 billion in funding over the next decade for domestic research, commercialization, and manufacturing of semiconductors as well as next-generation technology and workforce development.6 The Inflation Reduction Act of 2022, which authorizes $391 billion in funding for climate change and domestic energy production, includes targeted tax incentives aimed at manufacturing U.S.-sourced materials and details key requirements around domestic sourcing.7
Below, a table summarizes some of the salient statistics and trends for a handful of mineral commodities that are of particular interest in the ceramic and glass industries.
Readers are encouraged to access the complete USGS report.
USGS Minerals Commodity Summaries
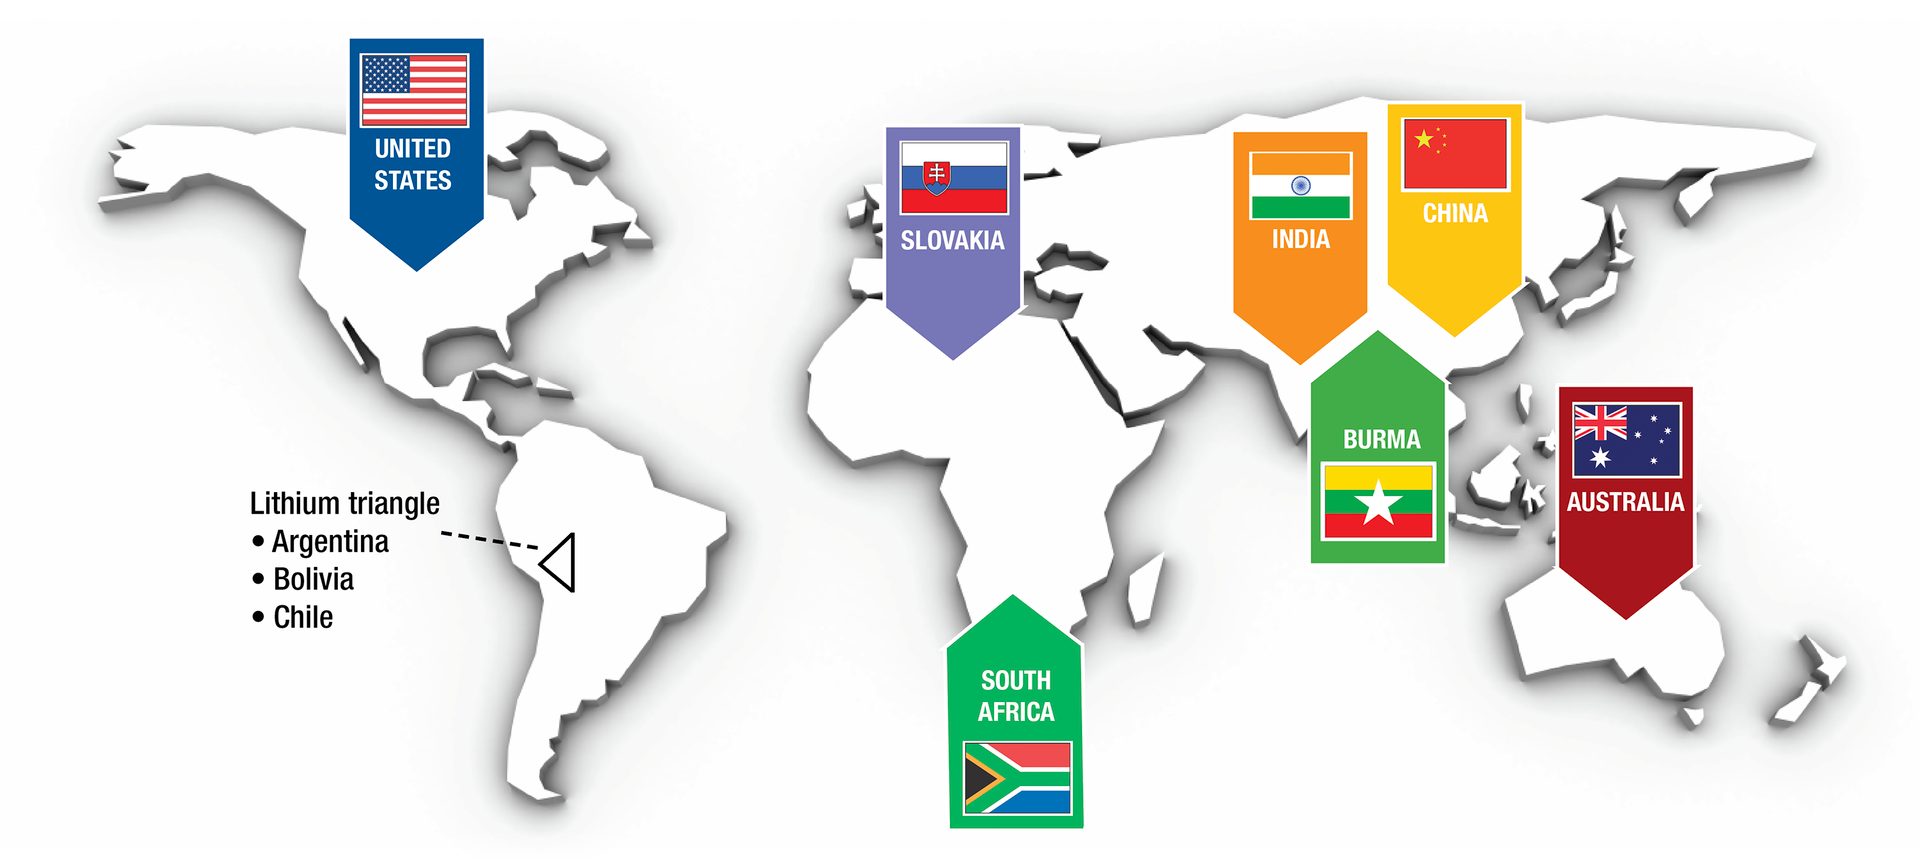
Leading producer highlights
AUGUST 2023 • VOL. 102, NO. 6
