bulletin | feature
Analytical X-ray techniques for chemical and structural characterization of ceramics
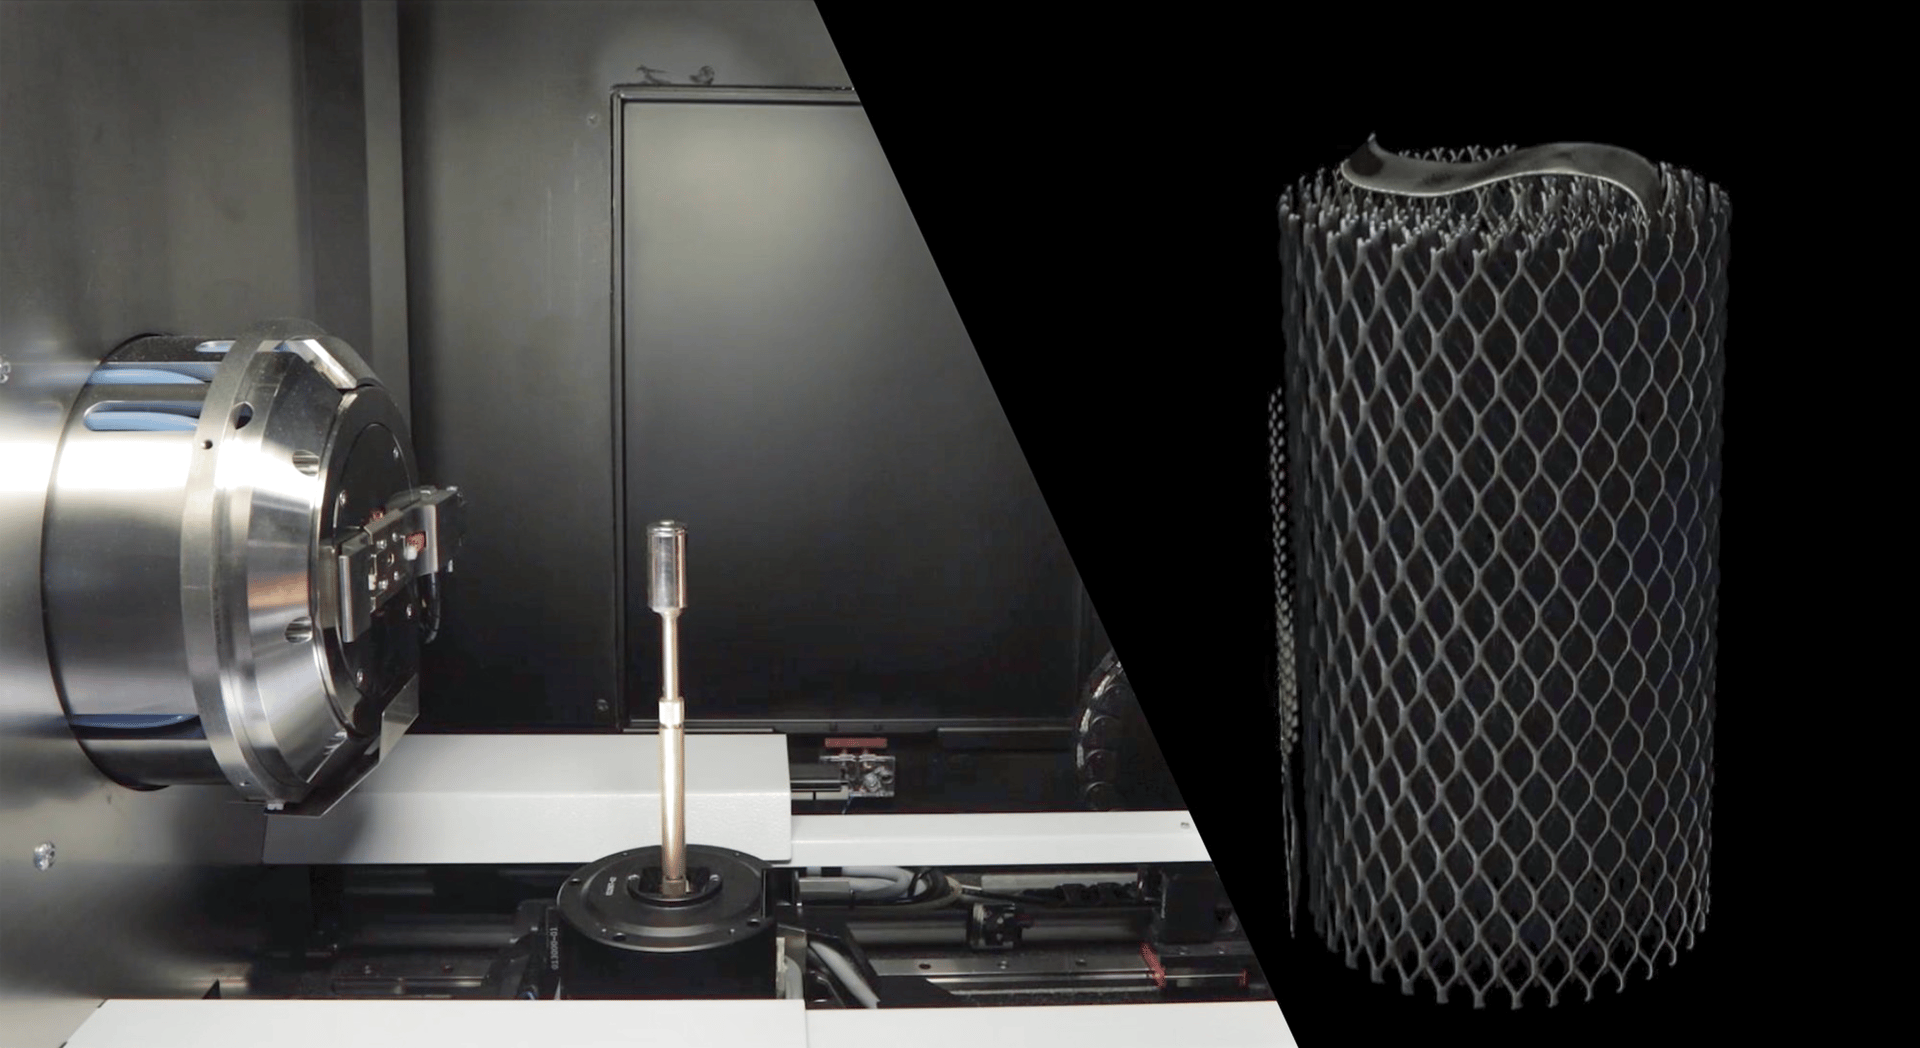
(Left) Imaging an oxide battery with a Bruker SKYSCAN 2214 X-ray microsope. (Right) 3D dataset can be reconstructed and then visualized for inspecting internal structures, such as the mesh shown here.
Credit: Henderson, Hill, Sampson, and Sedlmair
X-ray techniques are key instrumental methods for chemical and structural analysis of ceramics. This article provides a high-level overview of several analytical X-ray technologies.
By Nathan Henderson, Tina Hill, David Sampson, and Julia Sedlmair
Materials testing is essential to qualifying ceramics at various stages of the production cycle—from raw materials verification to characterizing finished formed parts.
In this article, we highlight several key instrumental methods for chemical and structural analysis of ceramics: X-ray fluorescence in both bulk- and microscale applications (XRF and µXRF, respectively), powder X-ray diffraction (XRD), and X-ray microscopy (XRM).
XRF measurements provide information regarding chemical and elemental composition and can be used in both qualitative and quantitative experiments. Bulk XRF methods are used to test raw feedstocks to verify reagent purity and the desired ratios in intermediate and final products. µXRF provides similar information within a constrained physical area, allowing for elemental mapping of parts and surfaces. XRD can identify and quantify crystalline polymorphs by distinguishing between different packing arrangements of atomic and molecular species. Finally, XRM is an imaging technique that explores internal structure and allows for the characterization of features such as cracks and defects.
We will discuss each technique in the following sections, providing a high-level overview of the method as well as relevant examples of the types of data one can expect from an experiment. Additionally, we will describe a case study that uses multiple techniques for a more thorough sample analysis.
ADVERTISEMENT

X-ray fluorescence
XRF spectrometry plays a crucial role in the ceramics industry for process control and contamination tracing. It enables rapid, nondestructive elemental analysis, ensuring products meet quality standards.
By monitoring elemental composition in real-time, manufacturers can optimize production conditions and detect deviations early in the process. The sensitivity of XRF allows for the identification of contaminants and unknown materials, contributing to quality assurance. The nondestructive nature of XRF makes it a cost-effective and efficient tool for assessing ceramic composition and maintaining product consistency throughout the manufacturing process.
In an XRF experiment, information about the elemental composition of a material is produced through the interactions of a sample and a beam of X-rays. One interaction that occurs is a core electron (K or L shell) is freed by the incident beam, and the vacancy is filled by the transition of an outer shell electron. These transitions result in the generation of fluorescent photons with characteristic energies that can be used to identify distinct elements, much like a fingerprint. X-rays can also be scattered by the material via elastic (Raleigh) or inelastic (Compton) processes without core electron interactions, yielding information about the general matrix.
For ceramics, this technique is used to quantify raw materials and additives; determine ratios of major compounds; screen for impurities; and for specialized tasks, such as determining coating thickness. Following elemental identification, quantification can be achieved through use of a calibration curve or by modeling with fundamental parameters. With respect to precision, repetition studies typically demonstrate standard deviations of less than 0.5 rel.% for major compounds, less than 1 rel.% for minor compounds, and down to the single digit parts per million (ppm, absolute) for trace amounts.
XRF instrumentation can be categorized as either energy dispersive (ED-XRF) or wavelength dispersive (WD-XRF), with some differences in components and detection (Figure 1, below). ED-XRF acquires wide-range spectra during a measurement. There are few moving parts, and it is often used for fast, routine measurements in quality control environments. Current state-of-the-art 8k detectors differentiate between the most common elements.
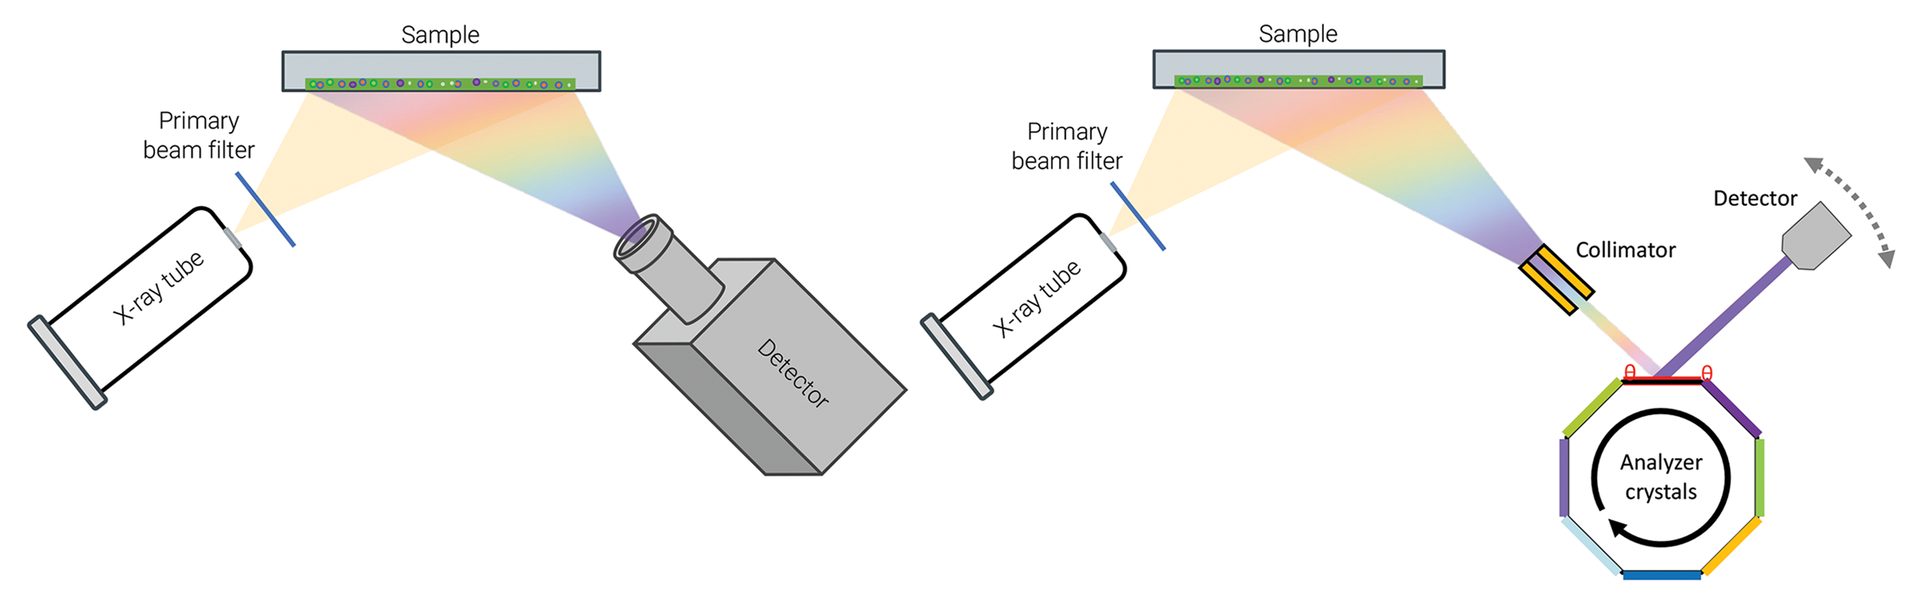
Figure 1. Schematic highlighting the difference between ED-XRF (left) and WD-XRF (right). ED-XRF instruments collect wide energy spectra while WD-XRF instruments have additional components in the beam path and higher energy, which allow for increased resolution.
Credit: Henderson, Hill, Sampson, and Sedlmair
WD-XRF finds use in applications that require higher resolution and precision. In a WD-XRF instrument, tailored crystals are used to determine X-ray energies by reading the signal with a detector at a specific angle. Collimators can also be used to parallelize the beam and sharpen the observed peaks. The combination of crystal and collimator in the optical path are used to resolve features in the spectrum, which distinguishes WD-XRF instruments from ED-XRF.
Data collected from a sample of cordierite, a refractory silicate, via both ED-XRF and WD-XRF are shown in Figure 2. The major elements such as aluminum and silicon are easily identified with both datasets, though the WD-XRF data has higher resolution for elements such as barium, titanium, potassium, and calcium.
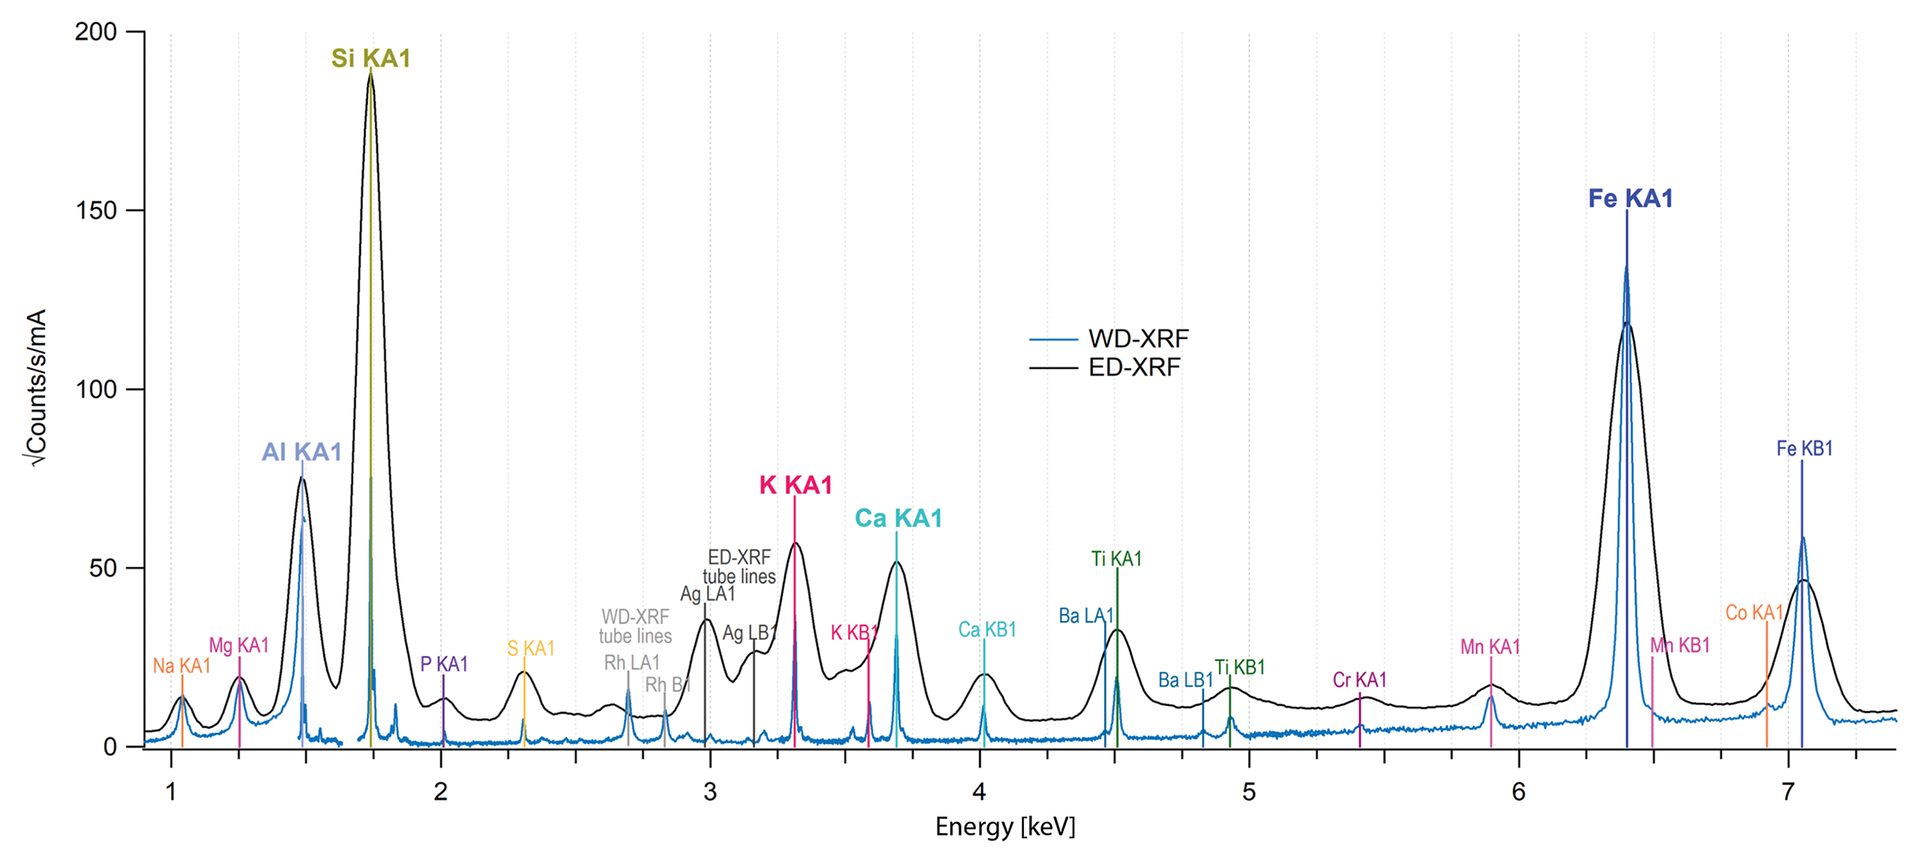
Figure 2. Fluorescence data from a cordierite sample collected with ED-XRF (black spectrum) and WD-XRF (blue spectrum). Major elements are easily identified with both methods though the increased sharpness in the WD-XRF data can help with identifying minor elements.
Credit: Henderson, Hill, Sampson, and Sedlmair
For a simple measurement, sample preparation is straightforward. A loose powder or liquid is poured into a cup and measured directly in air or helium through a thin polymer foil. Powders can also be pressed into stable briquets or fused into glass beads for higher precision.1 The typical elemental range is fluorine to americium, but, with the right configuration, light elements down to carbon (using ED-XRF) and even beryllium (using WD-XRF) can be measured. XRF can cover six orders of magnitude within one measurement, starting as low as single digit parts per million.
Figure 3 shows an example of a calibration curve for magnesia in alumina using ED-XRF. The magnesium signal for measured standards is integrated and plotted versus known concentration. This calibration curve can then be used for any unknown samples with the same matrix—the response for the same peak will yield the concentration in the unknown. The standard deviation shows the excellent linearity that can be achieved with an XRF measurement. This approach can also be used for calculating other parameters, such as Al/Si ratios in aluminosilicates.2
In the absence of standards, many commercially available XRF spectrometers also offer a standardless method using fundamental parameters. In this process, a model is calculated based on peak deconvolution, yielding an educated guess for sample composition.
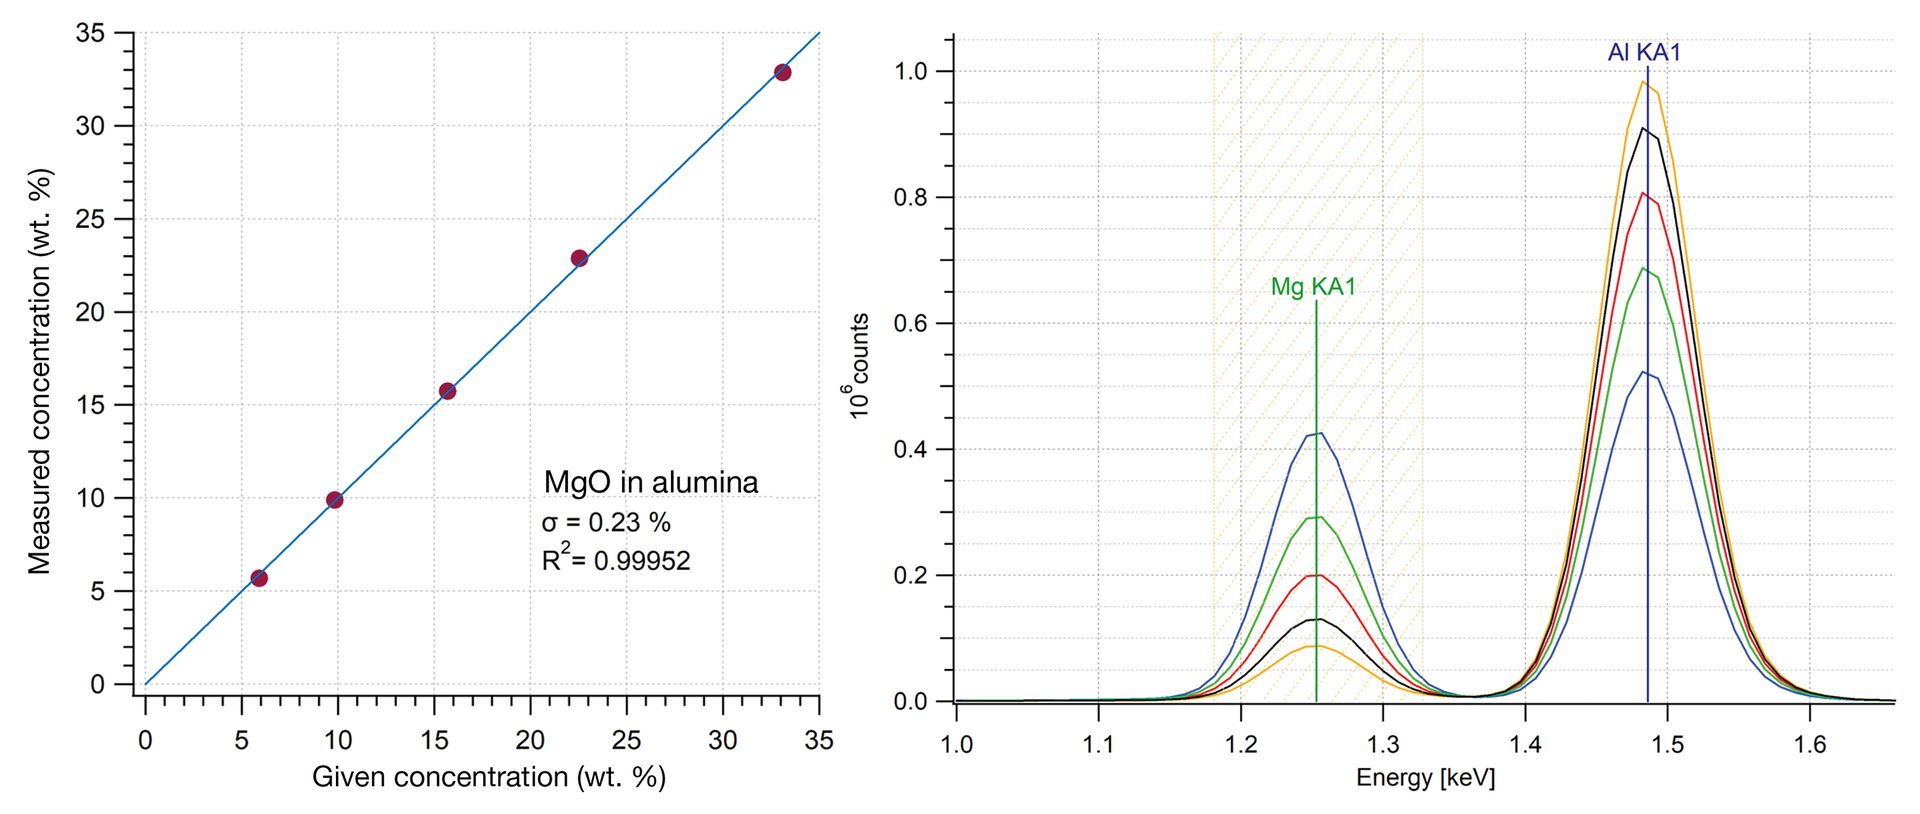
Figure 3. A calibration curve for measuring magnesia (MgO) in alumina (Al2O3) demonstrating very good linearity. Plotted data is the integrated intensity for the manganese signal in the XRF spectra versus known concentration in the calibration standards. Unknowns with similar composition could be measured against this calibration curve.
Credit: Henderson, Hill, Sampson, and Sedlmair
Micro X-ray fluorescence
µXRF is an emergent technique that finds increasing use in various scientific disciplines. It excels in providing high-resolution elemental composition maps and spatial distributions, especially in the analysis of challenging samples and advanced materials.
This instrumental technique combines the principles of traditional XRF with the use of a small, focused beam of X-rays. This addition enables the measurement of elemental composition at extremely small spot sizes with exceptional spatial precision, down to less than 20 µm. Sophisticated polycapillary lenses help minimize the loss of X-ray intensity from traditional collimators, which in turn helps maintain high sensi-tivity to trace elements with detection limits as low as tens to hundreds of ppm for many elements.
A motorized stage with precise sample positioning can be used to produce elemental distribution maps and provide contextual information about areas of interest within a sample. One notable feature is the simplicity of preparing samples, making it suitable for various shapes and sizes. The collected data, presented as energy dispersive spectra for each pixel, enable a thorough examination of elemental distribution maps, providing both qualitative and quantitative insights.
Experiment design includes choice of spot size, measured intensity, and step size. These factors will determine sensitivity and spatial resolution. Further experimental conditions can include options such as various X-ray sources for optimizing specific elements of interest as well as an optional purge with helium gas, which enables the analysis of moist or wet samples. A robust standardless quantification algorithm, based on fundamental parameters, is also beneficial, particularly for the analysis of complex materials where standards may be scarce or unavailable.
While conventional XRF finds widespread use in industrial materials such as oxides or cement, µXRF specializes in complex materials analysis, particularly where mapping and elemental distribution are pertinent. Relevant fields include materials science, microelectronics, forensics, archaeology, art conservation, and more—any application where fast elemental mapping, quantification, and trace analysis are beneficial.
An example dataset from a garnet mineral specimen is shown in Figure 4. Each pixel in the dataset has an associated ED-XRF spectrum; this information can be used to generate colored maps that correspond to distribution of identified elements. Data can be viewed not only as individual elements but also as a function of signal or concentration, allowing for multiple approaches to visualization.
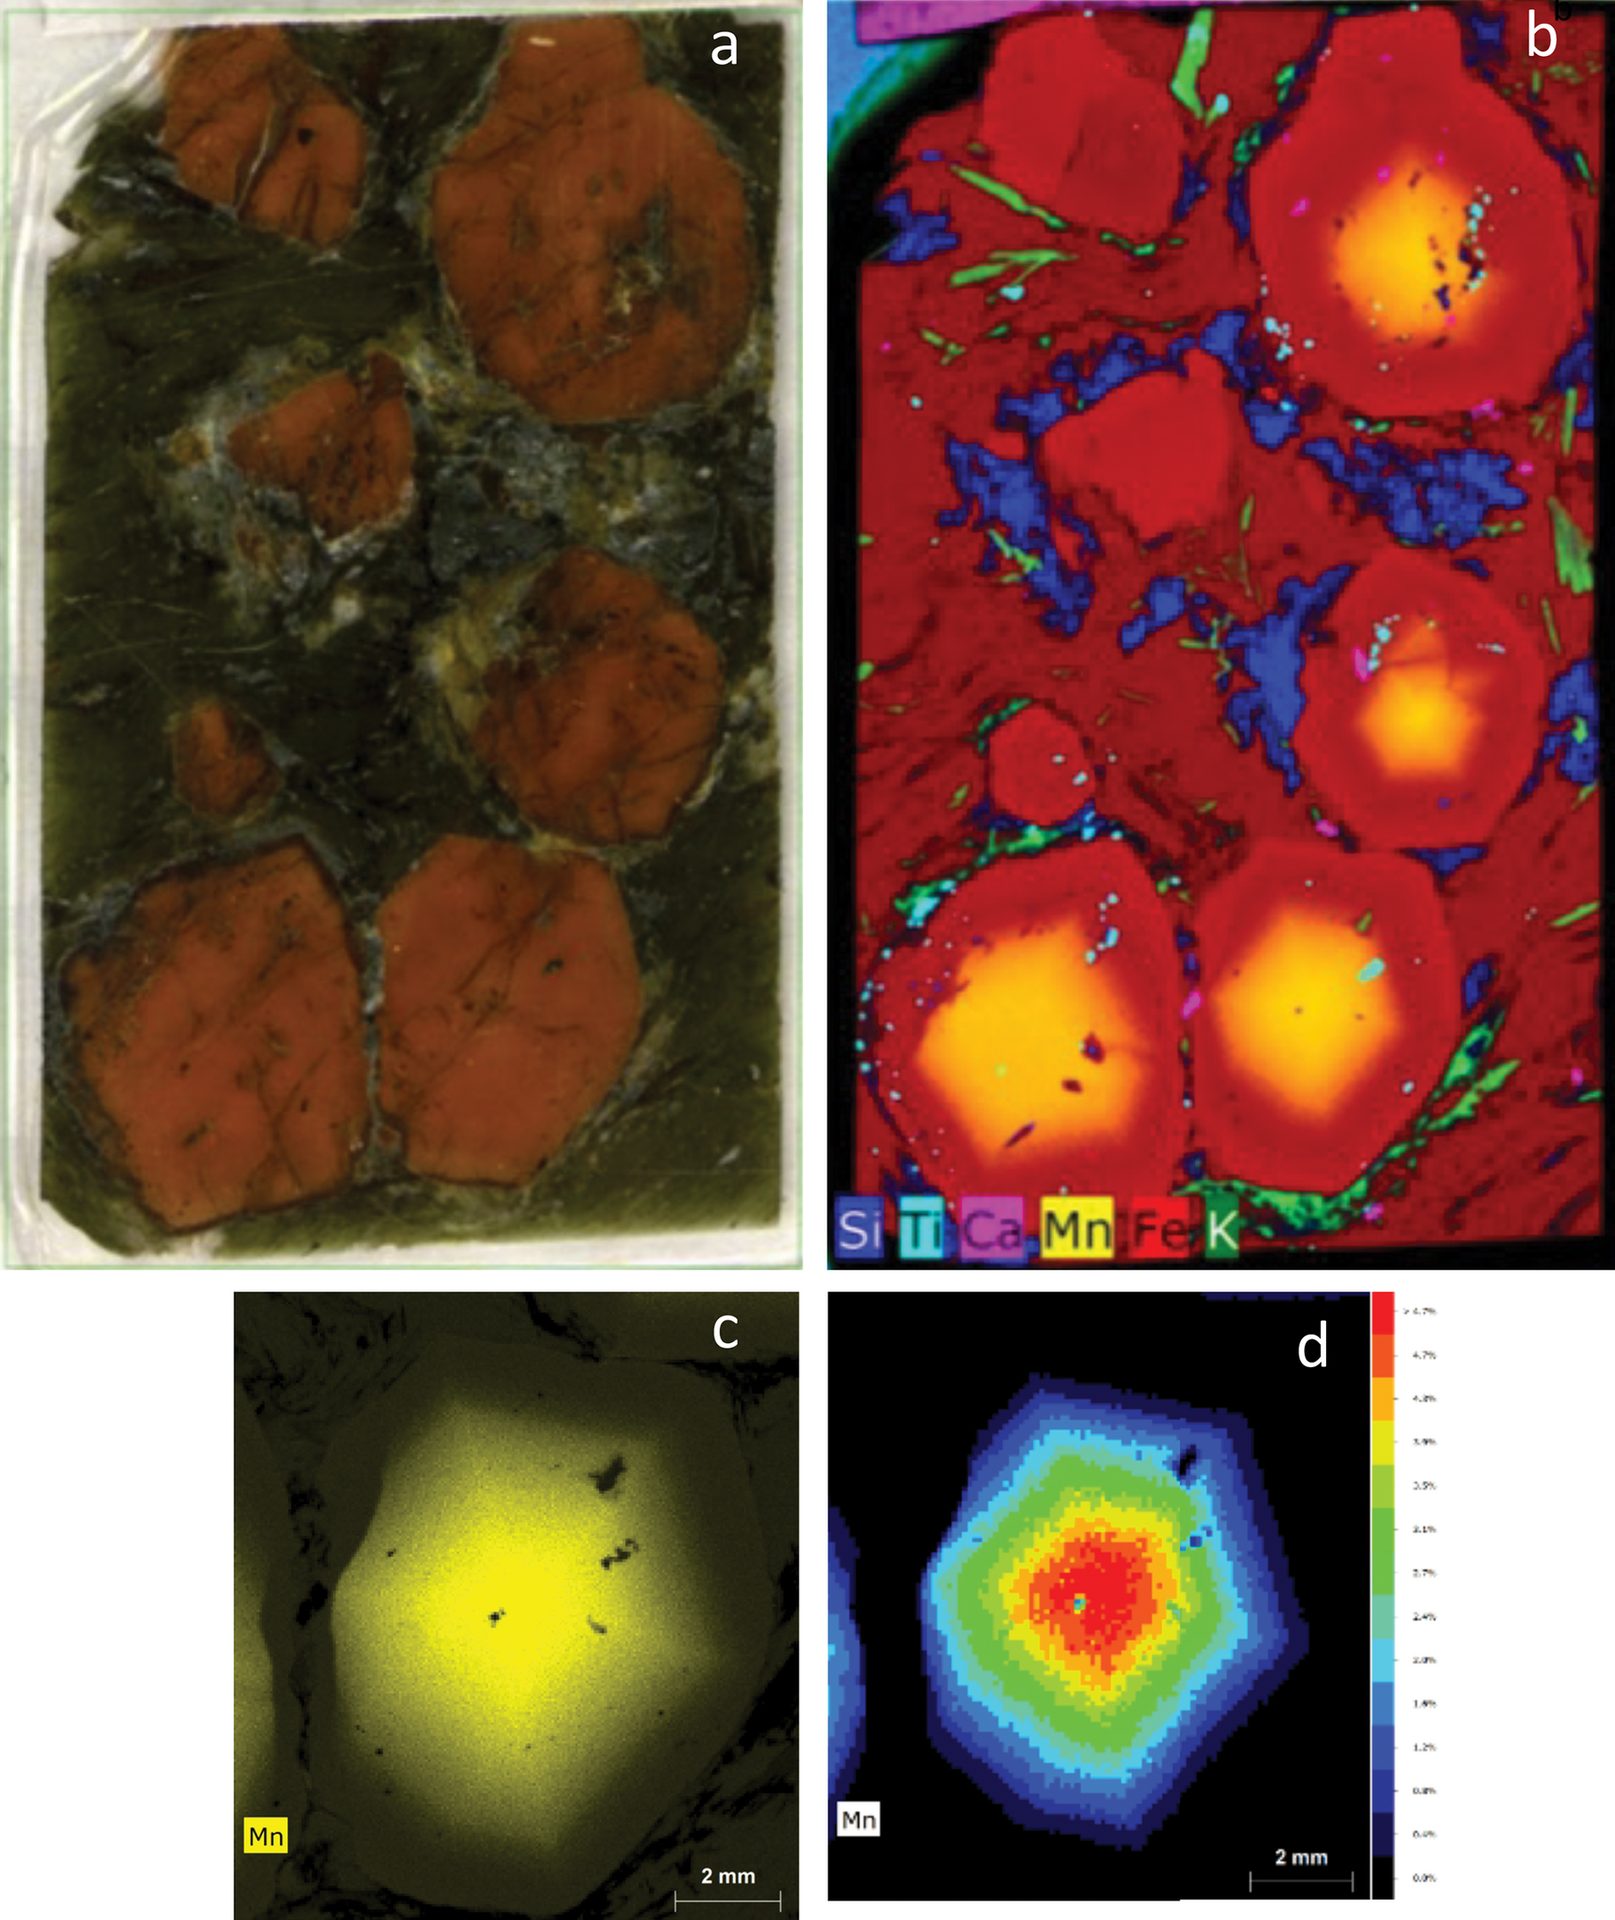
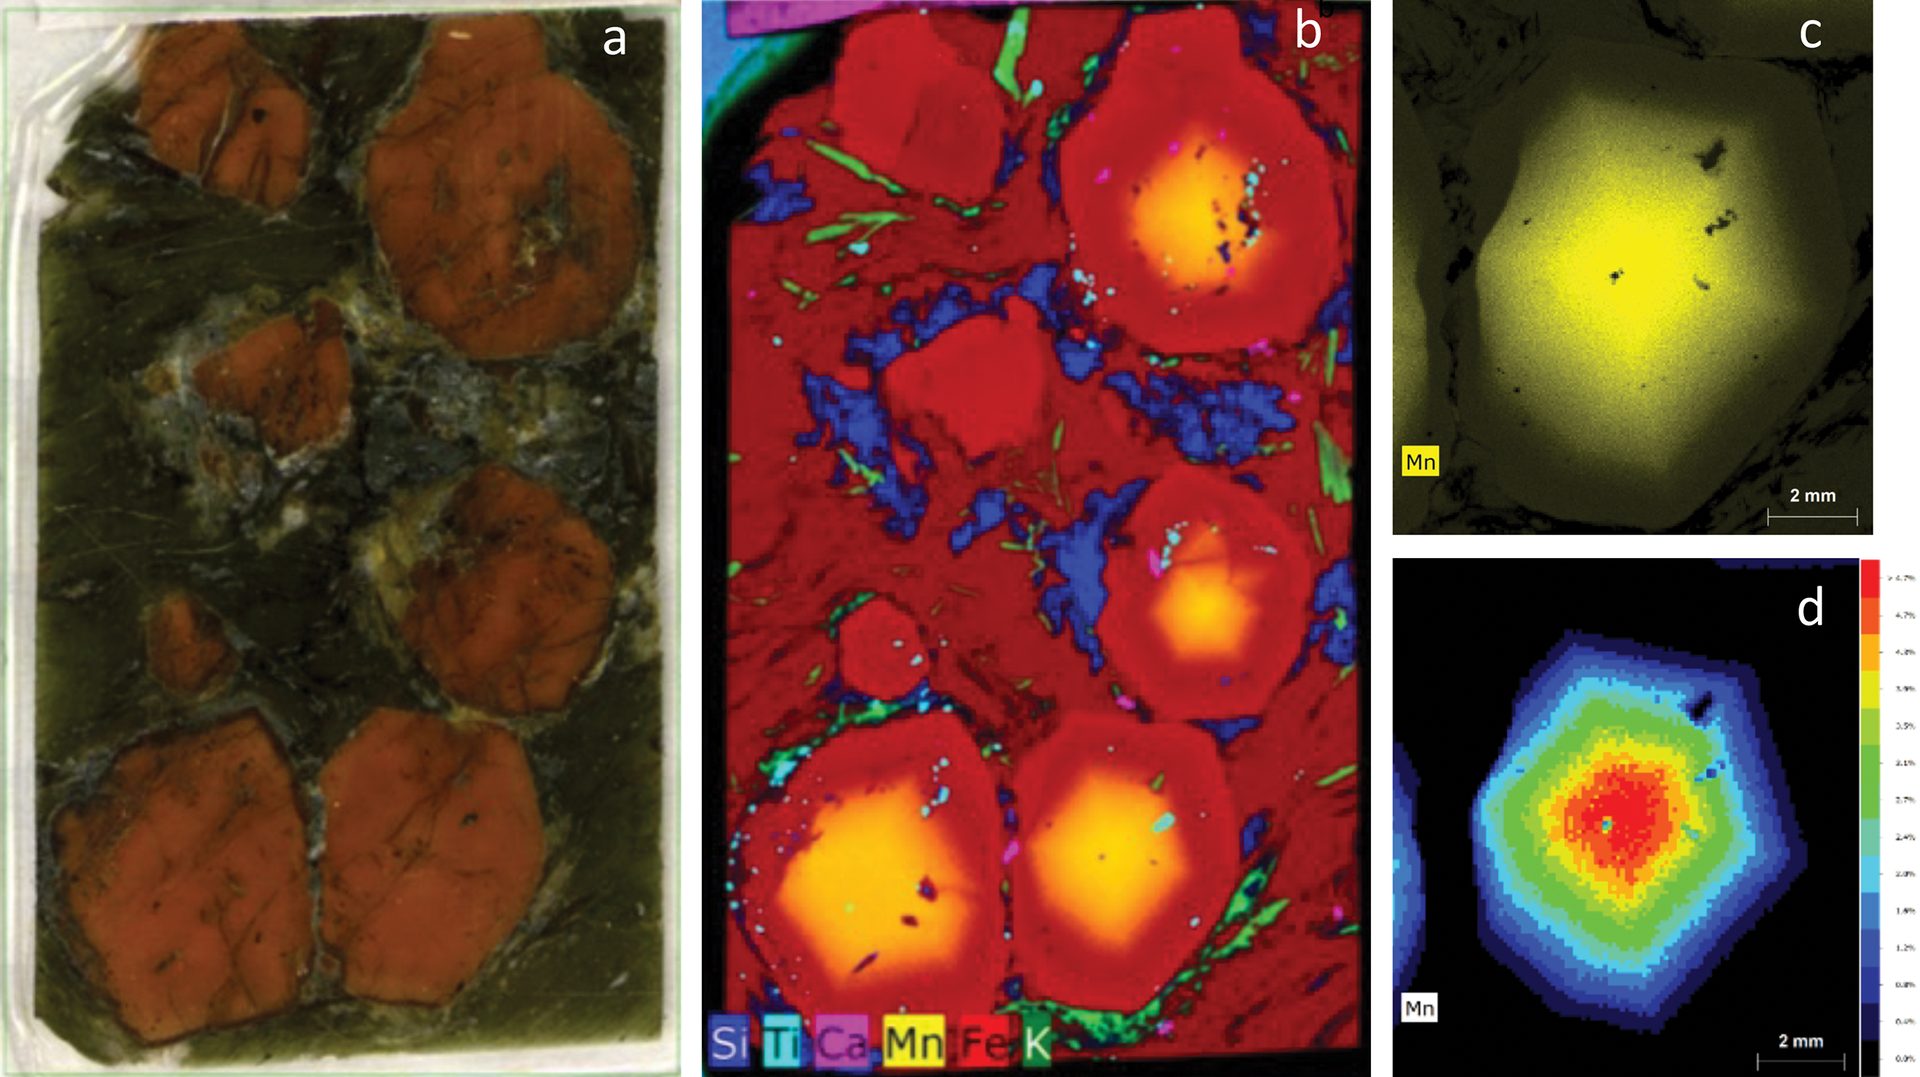
Figure 4. A thick section of a garnet sample (a) and X-ray elemental distribution map for elements silicon, titanium, calcium, manganese, iron, and potassium (b). For the bottom right crystal, an additional scan was performed using a primary filter to achieve better peak to background for the elemental peaks and minimize spectrum artifacts, such as diffraction peaks. From this measurement, the manganese distribution is displayed as intensity (c) and quantification maps (d), which show the highest intensity (highest concentration of elements) in the core of the grain.
Credit: Henderson, Hill, Sampson, and Sedlmair
X-ray diffraction
While the previously discussed techniques focus on elemental analysis, XRD is concerned with how the identified elements are connected in three-dimensional motifs. This technique provides structural information about the repeating atomic order found in crystalline materials. Relevant applications include identification of crystalline phases, distinguishing between structural polymorphs (e.g., rutile versus anatase forms of titania), quantification of mixtures, calculation of amorphous/glass content, and understanding sintering processes at elevated temperatures.
XRD studies are significant at multiple points throughout the production cycle of refractories and other ceramics: verifying phase purity of chemical precursors, testing for impurity phases or unconsumed reagents, and optimizing firing conditions for desired final products with correct physical properties.
In a traditional XRD experiment (Figure 5), a powdered sample is prepared as a flat surface and mounted in the center of the diffractometer. A goniometer provides precise control over the angular positions of the X-ray source and detector relative to the sample, down to thousandths of a degree.
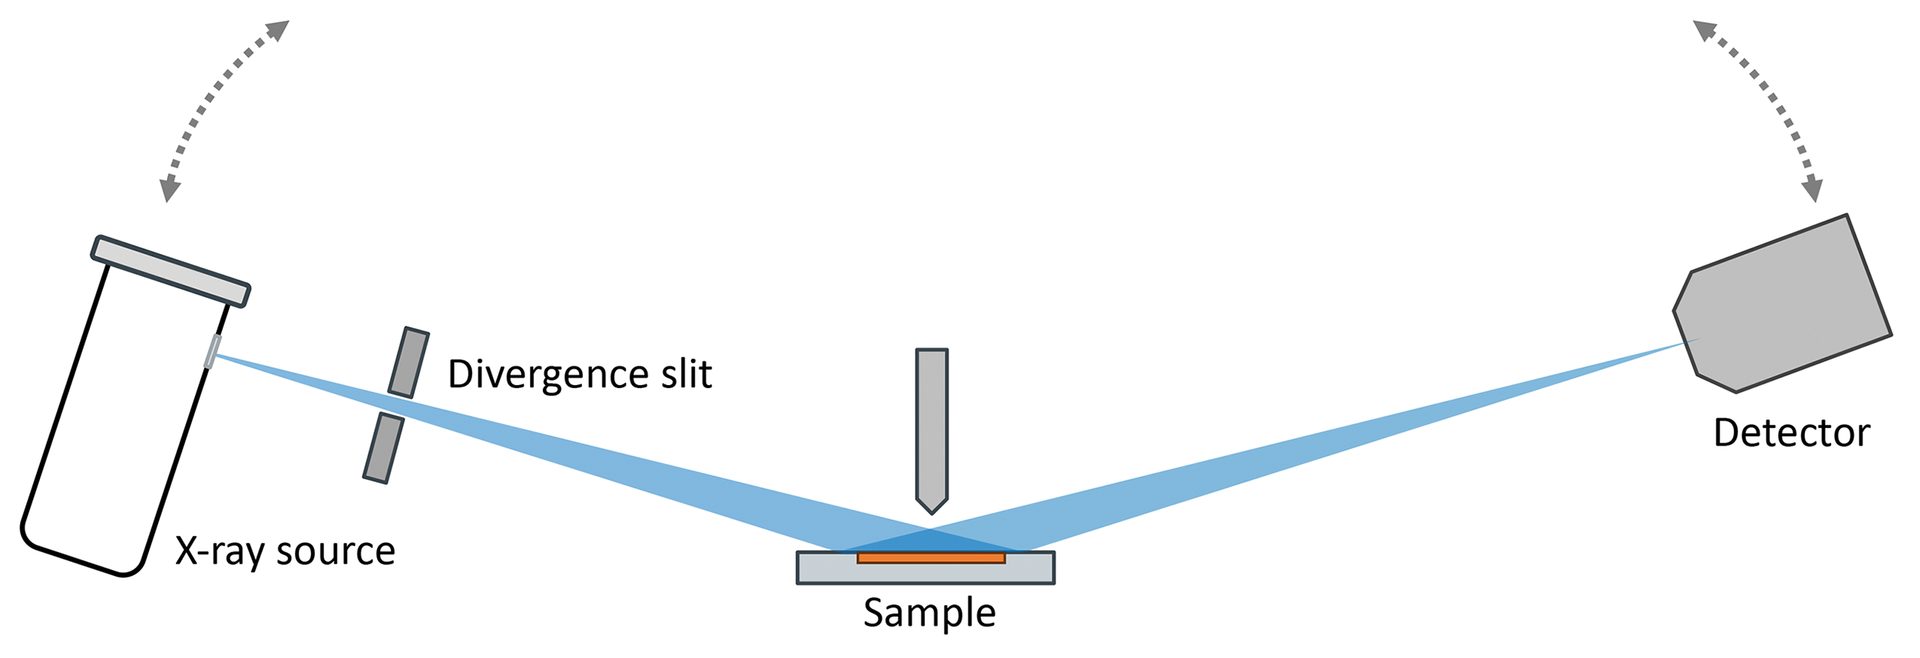
Figure 5. Schematic of a traditional Bragg diffractometer. The X-ray tube (left) and detector (right) are moved together in a coupled manner to increasingly high angles relative to the sample (center). Constructive interference will yield strong diffraction intensity at special angles that are descriptive to a crystalline phase.
Credit: Henderson, Hill, Sampson, and Sedlmair
A diffraction peak is observed as a sharp increase in signal when the Bragg equation (nλ = 2dsinθ) is fulfilled, which occurs at specific angles (2θ) due to constructive interference of the beam with periodic wavelength, λ. These special angles are related to characteristic distances (d) between repeating planes of atoms within a crystalline phase. The combination of peak locations and relative intensities is referred to as a diffraction pattern and can be thought of as the fingerprint for a material.
From a quantification standpoint, mixtures will exhibit convoluted signals for each phase, which can then be quantified with intensity ratios or with modeling from fundamental parameters. For the analysis of formed parts or controlled regions of interest, a spot beam can be generated with the use of specialty mirrors or collimators, though generally beam sizes for diffraction are larger (0.3–1.0 mm) than those used for µXRF.
Quartz and cristobalite are two distinct polymorphs of silica that are found within the refractory industry. XRD data shown in Figure 6 highlight the differences between these two phases as well as that of amorphous silica glass, which does not have repeating order and thus does not demonstrate diffraction peaks.
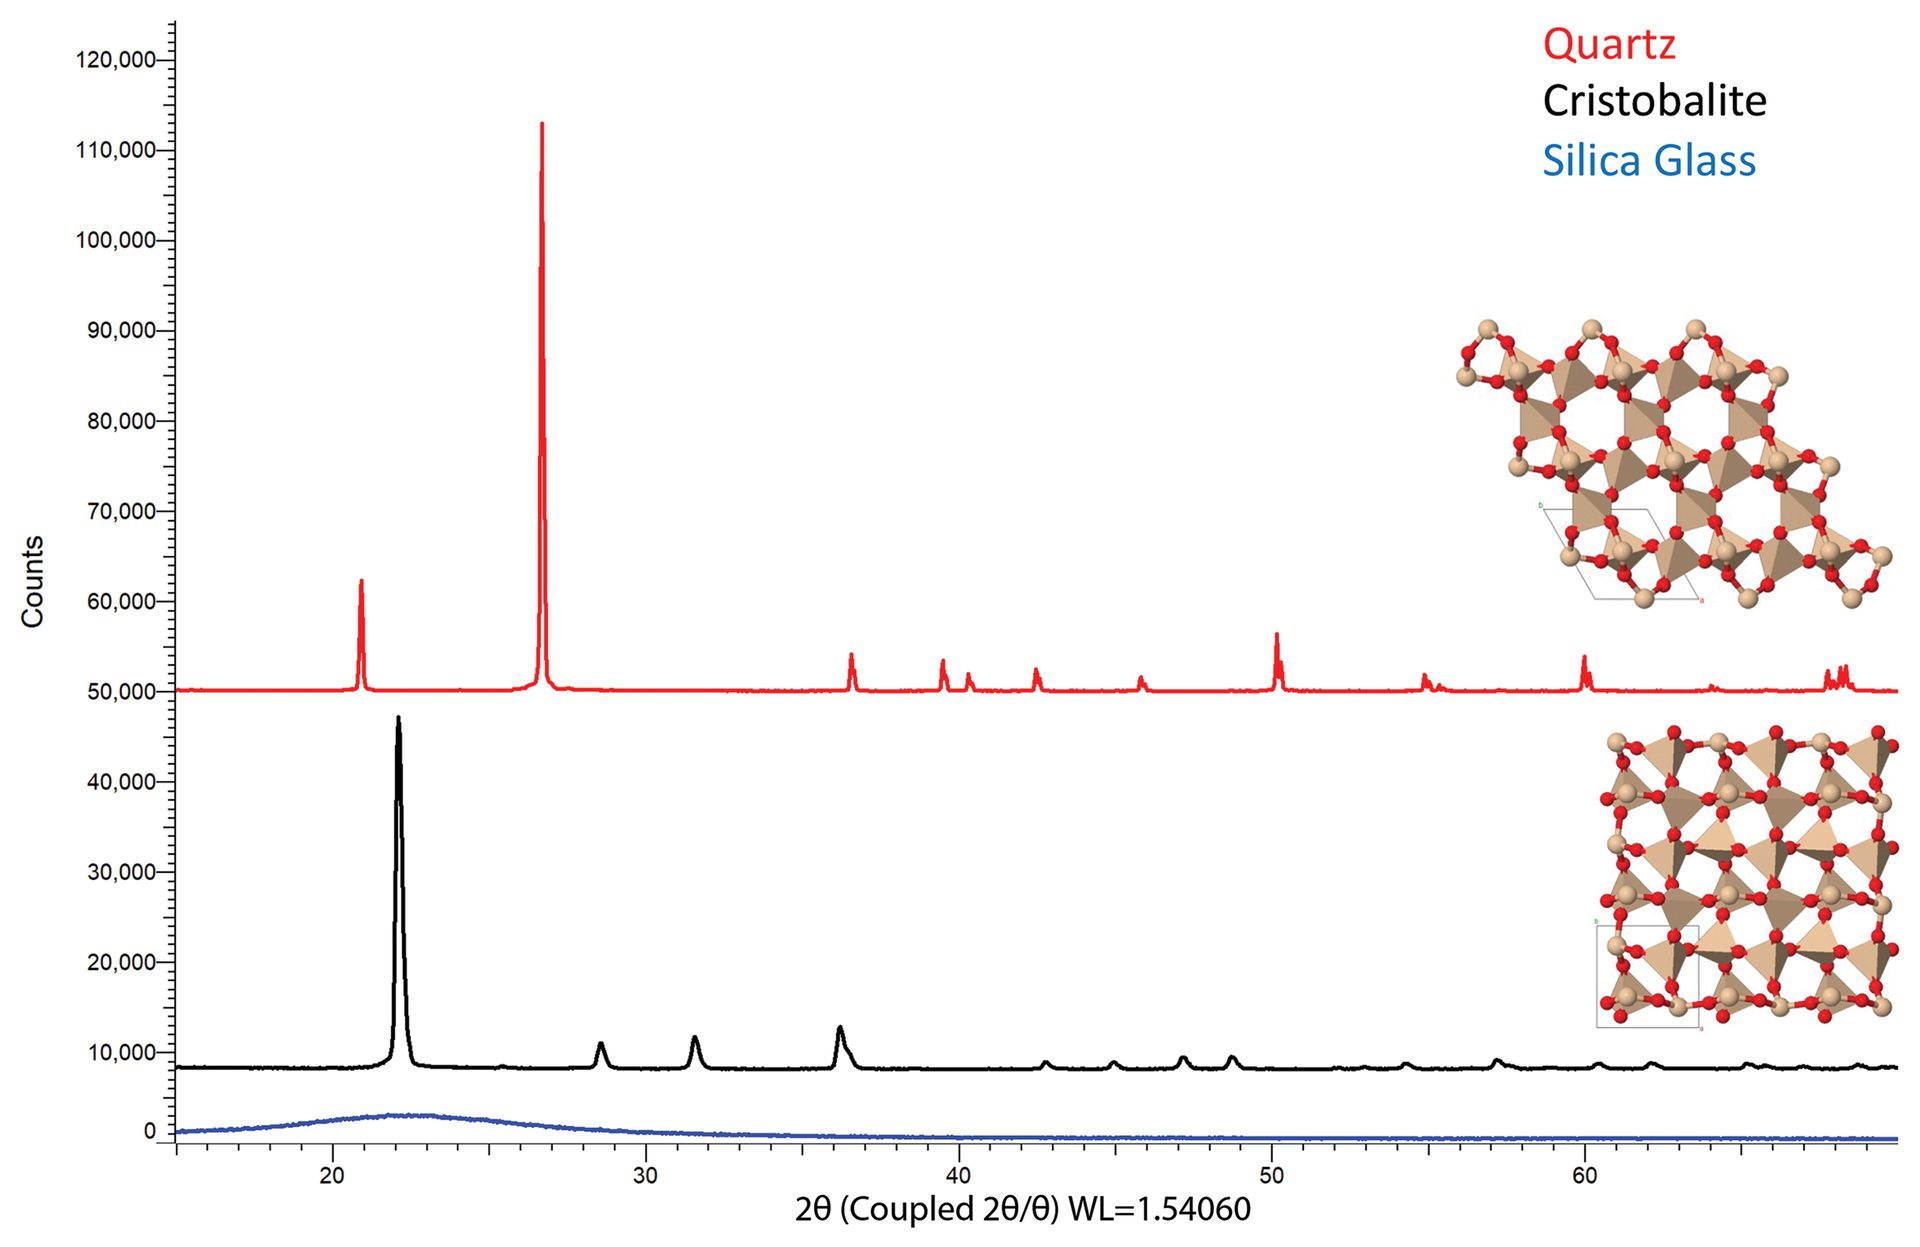
Figure 6. Diffraction data for quartz (top scan), cristobalite (middle scan), and silica glass (bottom scan). Though each polymorph is comprised of the same elements (silicon and oxygen), different arrangements of the atoms produce different fingerprint patterns. Quartz adopts a hexagonal structure (top structure), cristobalite forms a tetragonal structure (bottom structure), while silica glass has no long-range order and does not demonstrate diffraction.
Credit: Henderson, Hill, Sampson, and Sedlmair
Because many ceramic materials are synthesized in furnaces or kilns, temperature-dependent diffraction data is also helpful in understanding reaction mechanisms and formation conditions. If a diffractometer is equipped with a furnace or heater, data can be collected directly at elevated temperatures (in situ). Samples can also be characterized after sintering or processing in a stand-alone furnace (ex situ).
Some experiments involve collecting dozens or hundreds of diffraction patterns, in which case an intensity map can provide a useful way of portraying the data. The intensity map in Figure 7 shows the formation of mullite (3Al2O3·2SiO2) from the decomposition of kaolinite (Al2Si2O5(OH)4) at elevated temperatures. Kaolinite converts to metakaolin around 550°C, transitions through an amorphous intermediate through 800°C, and then to γ-A2O3 and mullite at 1,100°C. Higher reaction temperatures and longer durations of heating can further drive the conversion process.
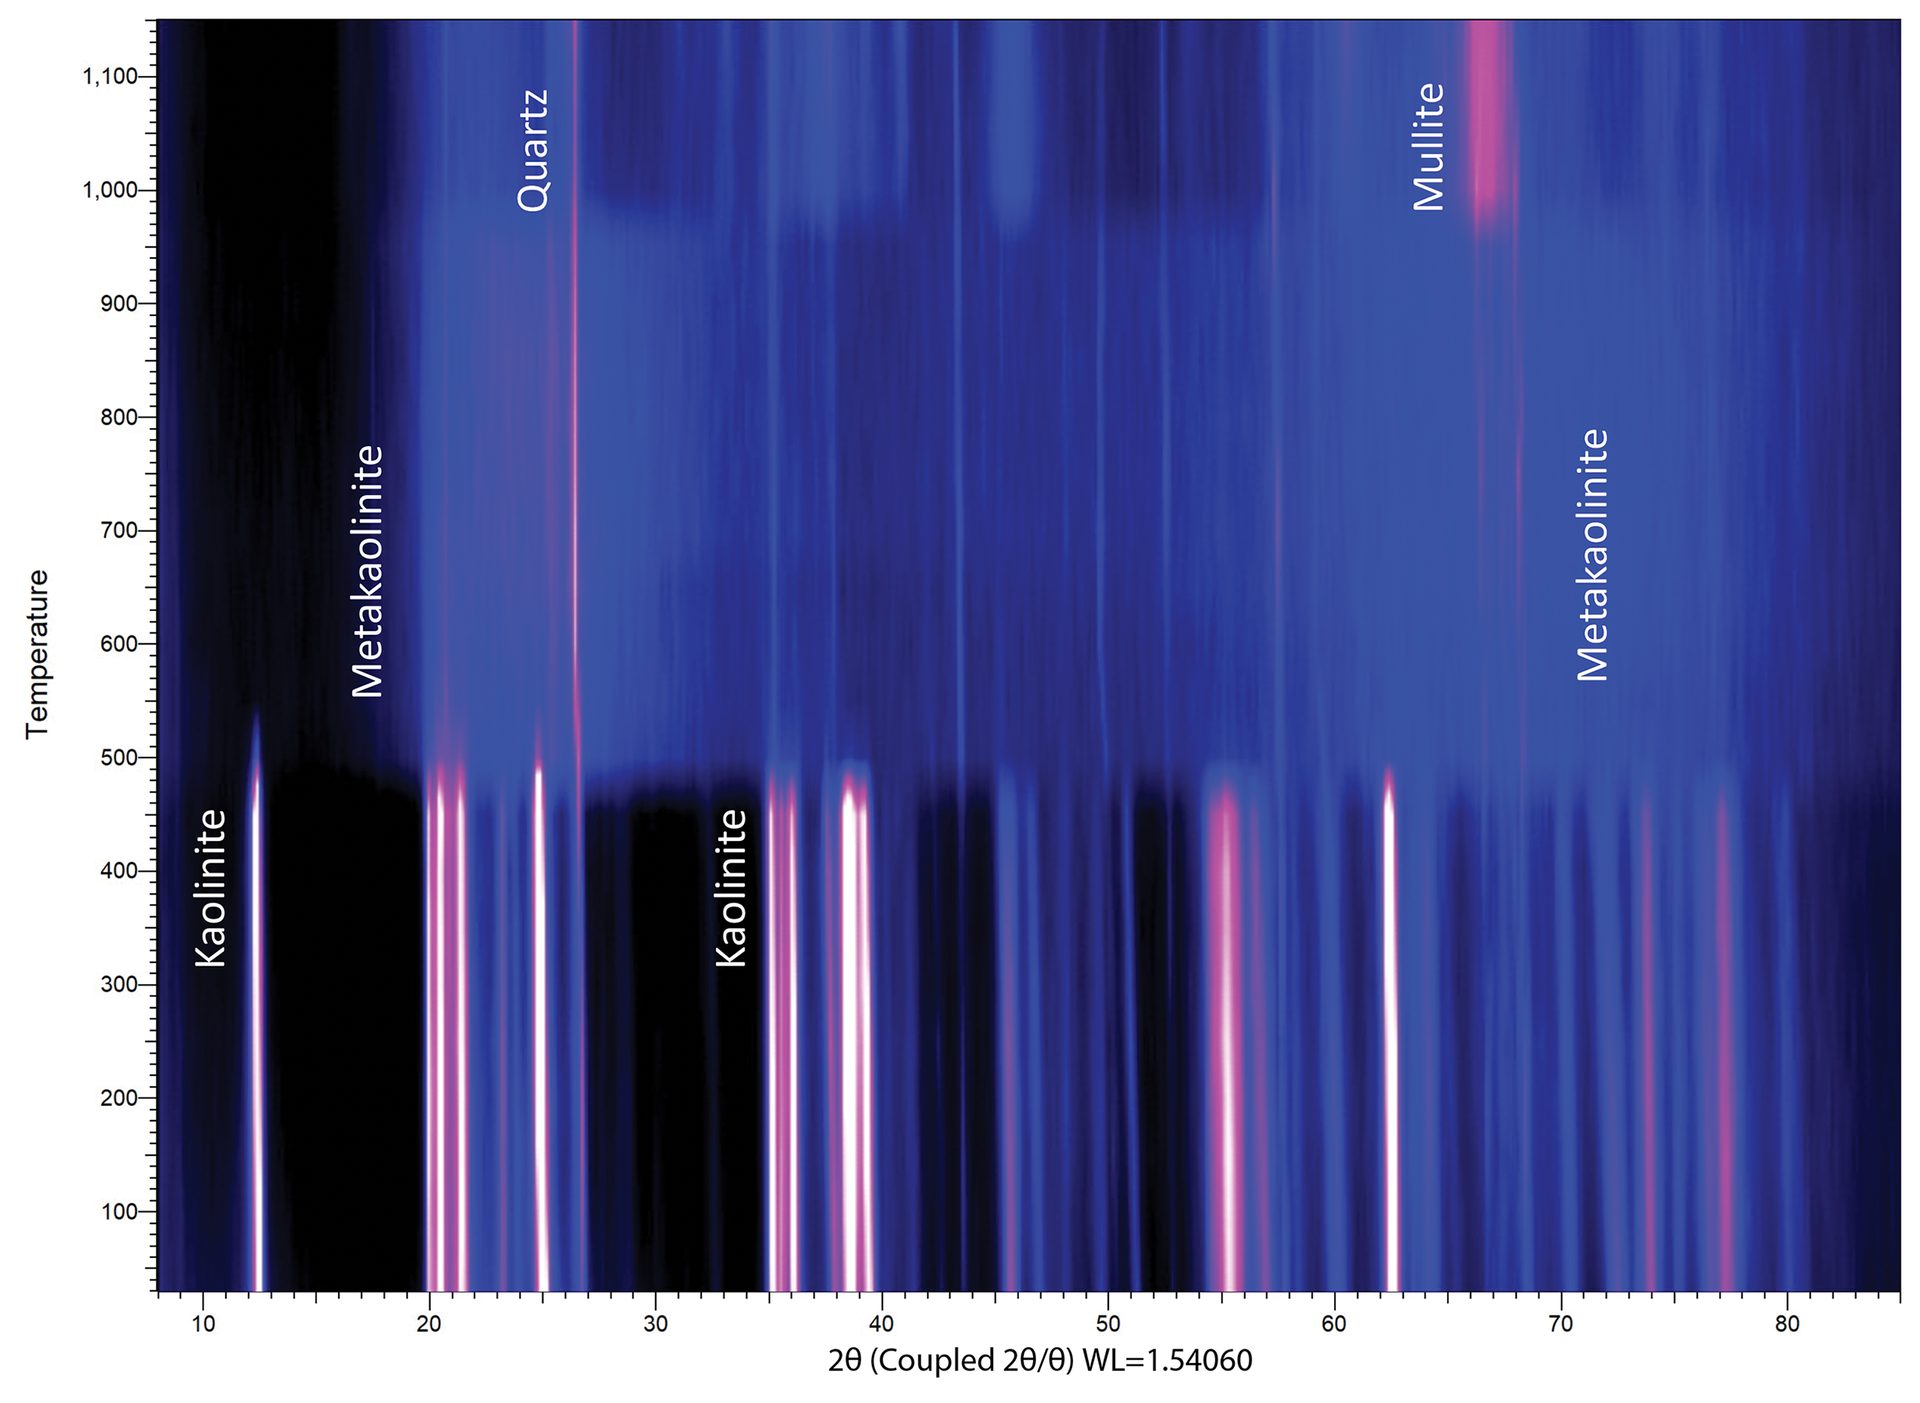
Figure 7. Intensity map for nonambient XRD data collected in situ with a heating furnace. The x-axis is 2θ, as is tradition, and the y-axis is temperature. Diffraction intensity is plotted here as a function of brightness (black is low intensity, white/pink is high intensity, blue colors are intermediate intensities).
Credit: Henderson, Hill, Sampson, and Sedlmair
X-ray microscopy
The final technology in this review is XRM, an imaging technique centered on two principles: contrast in X-ray transmission based on density, and geometric image magnification based on distance to a sensor. XRM is related to microcomputed tomography but extends these capabilities through the use of sophisticated software algorithms for statistical analysis and visualization as well as the potential for higher resolution.
Within the ceramics industry, XRM finds use in any application where structural imaging is desired, particularly for investigation of internal features. Samples are frequently characterized in their native state without the need for cutting, polishing, or sputter coating. Relevant uses include internal defects; void structures in porous or foamed ceramics; orientation of fibers and meshes; structural integrity of green and sintered parts formed via injection molding or 3D printing; and layer thickness in conductive oxides, such as batteries or fuel cells.
A schematic of a typical instrument is shown in Figure 8. An intense X-ray beam is generated at the source and optionally conditioned through various filters. The sample is mounted on a precision stage that allows for fine control over rotation angle; height; and distance between source, sample, and detector. As the X-ray beam passes through the sample, 2D radiographs are collected that provide information about differences in material density. Moving the sample closer to the source and further from the detector provides a magnified image from a smaller physical volume within the sample (geometric magnification).
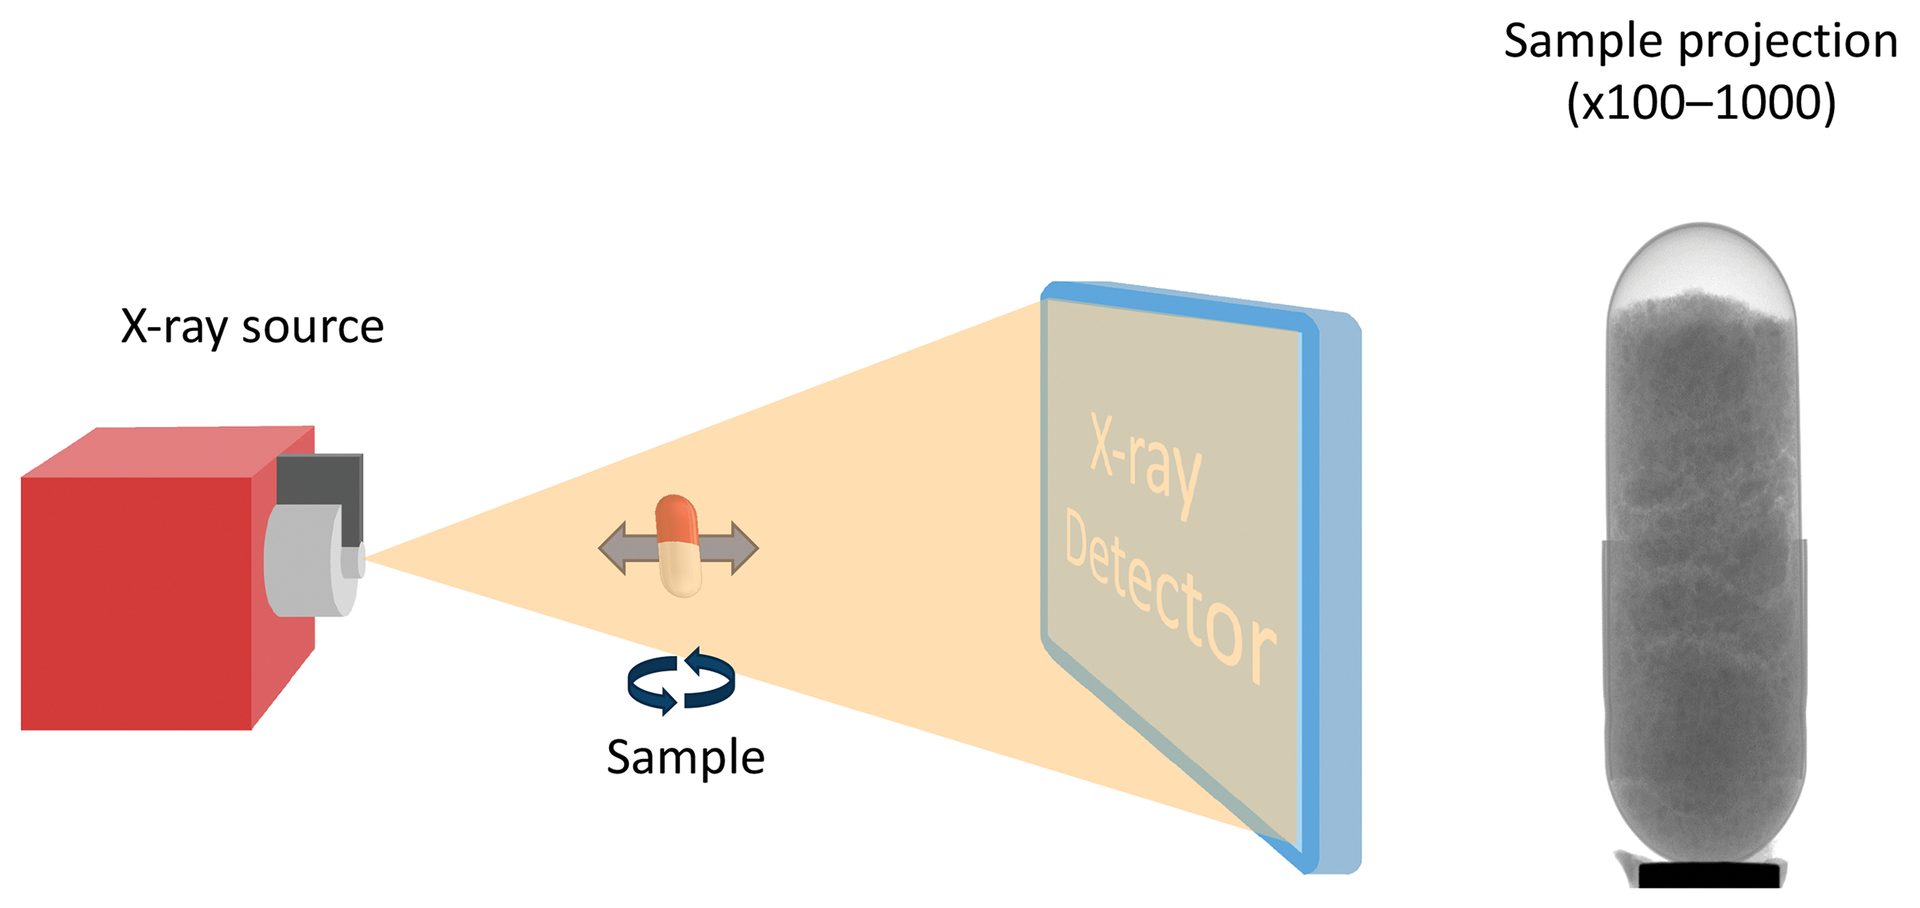
Figure 8. Schematic of an XRM experiment. The X-ray beam passes through the sample, which is placed at a specific distance from the source and detector to optimize for viewing region or magnification. The detector collects a 2D image of the sample where the beam is attenuated by more dense regions of the sample, providing contrast in the radiograph. The sample is rotated along the central axis, which provides a 3D image set that can then be reconstructed and analyzed in greater detail.
Credit: Henderson, Hill, Sampson, and Sedlmair
A full experiment will collect a stack of images with variable rotation angle and height. This data can then be processed into a 3D body that will be inspected for cracks, defects, porosity, and a multitude of other physical features. Perhaps most significantly, XRM is a nondestructive technique that allows for investigations of internal structures that might not be accessible through optical or electron microscopy.
Data collected from a sandstone core are shown in Figure 9. The consolidation and structure of the silica grains is clearly seen; however, the colored images provide an additional level of clarity and visualization. In the left reconstruction, the pores are displayed as an intensity gradient based on size. Similarly, the dense mineral grains are shown on the right, again plotted as function of size. These types of studies can be furthered with statistical analysis for calculations of total pore volume, histograms of grain sizes, and more.
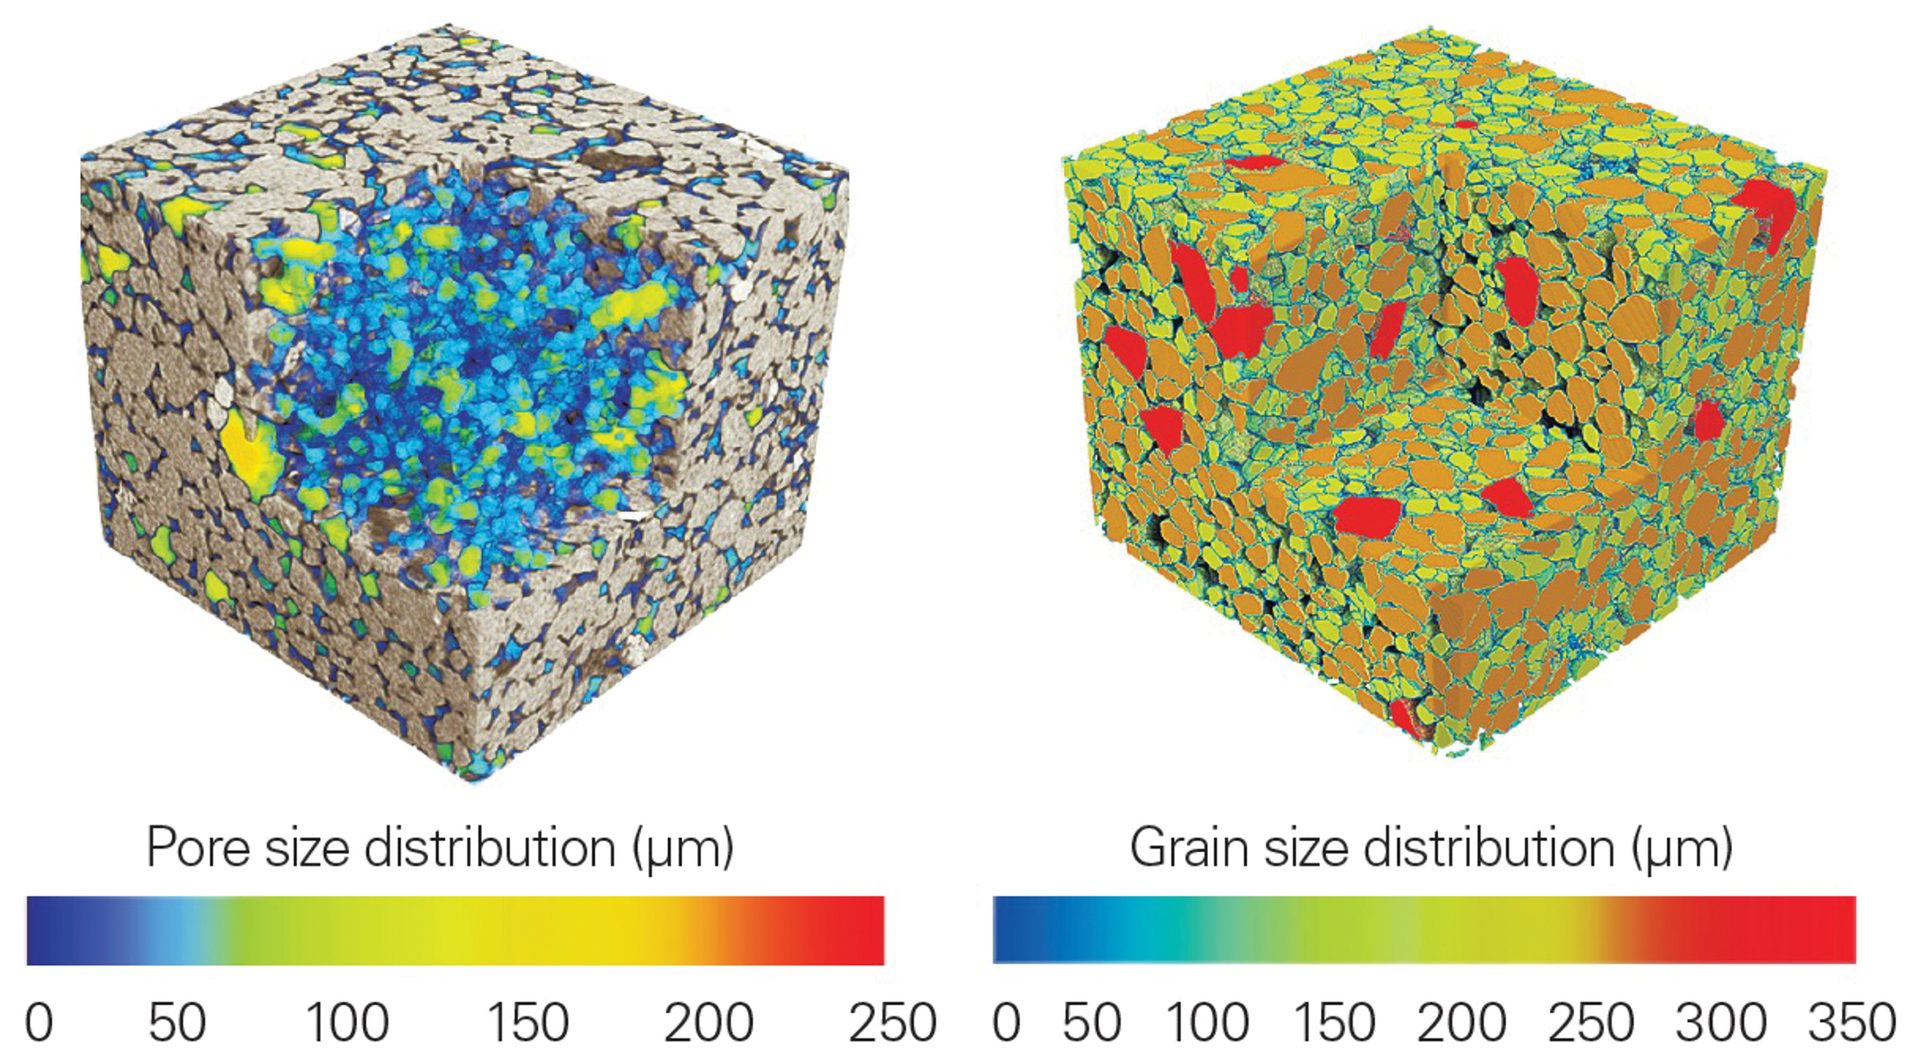
Figure 9. XRM data from a sandstone core with average size plotted as a function of intensity gradient for pores (left) and dense grains (right). This plot demonstrates a clever extension of the technique by visualizing the void space rather than the sample itself.
Credit: Henderson, Hill, Sampson, and Sedlmair
Case study: Injection molded ceramics
Two injection molded ceramic components were analyzed with multiple techniques to demonstrate how supporting technologies can provide a deeper level of material characterization.
The first sample—a white cylindrical fitting with a lustrous surface—was analyzed with µXRF at multiple points along the head and body using a Bruker M4 TORNADO. Elemental analysis reveals a consistent composition across the sample with zirconium as the major identified element. Smaller amounts of yttrium, hafnium, and silicon are also identified.
Hafnium is frequently found in zirconium-containing compounds due to difficulty in separating these two elements, so its presence here is unsurprising. Yttrium and silicon content are perhaps more interesting. Pure zirconia adopts a monoclinic structure at room temperature; however, many industrial applications use tetragonal or cubic stabilized forms of zirconia that can be obtained with substitutions of cations such as Y3+. The amount of dopant directly influences the stabilized form.3
Diffraction experiments provide insights into which crystalline forms are present. XRD data (Figure 10) were collected using a Bruker D8 DISCOVER diffractometer using a copper microfocus source and an EIGER2 R 500K area detector. The most intense diffraction signal is matched to the major phase, tetragonal ZrO2. Closer inspection of overlapping peaks reveals the presence of the cubic structure, and smaller peaks around the baseline are identified as the monoclinic form. In some specified applications, a small amount of monoclinic zirconia is targeted to provide increased toughness through a stress-induced transformation. This mixture of phases is referred to as partially stabilized zirconia.
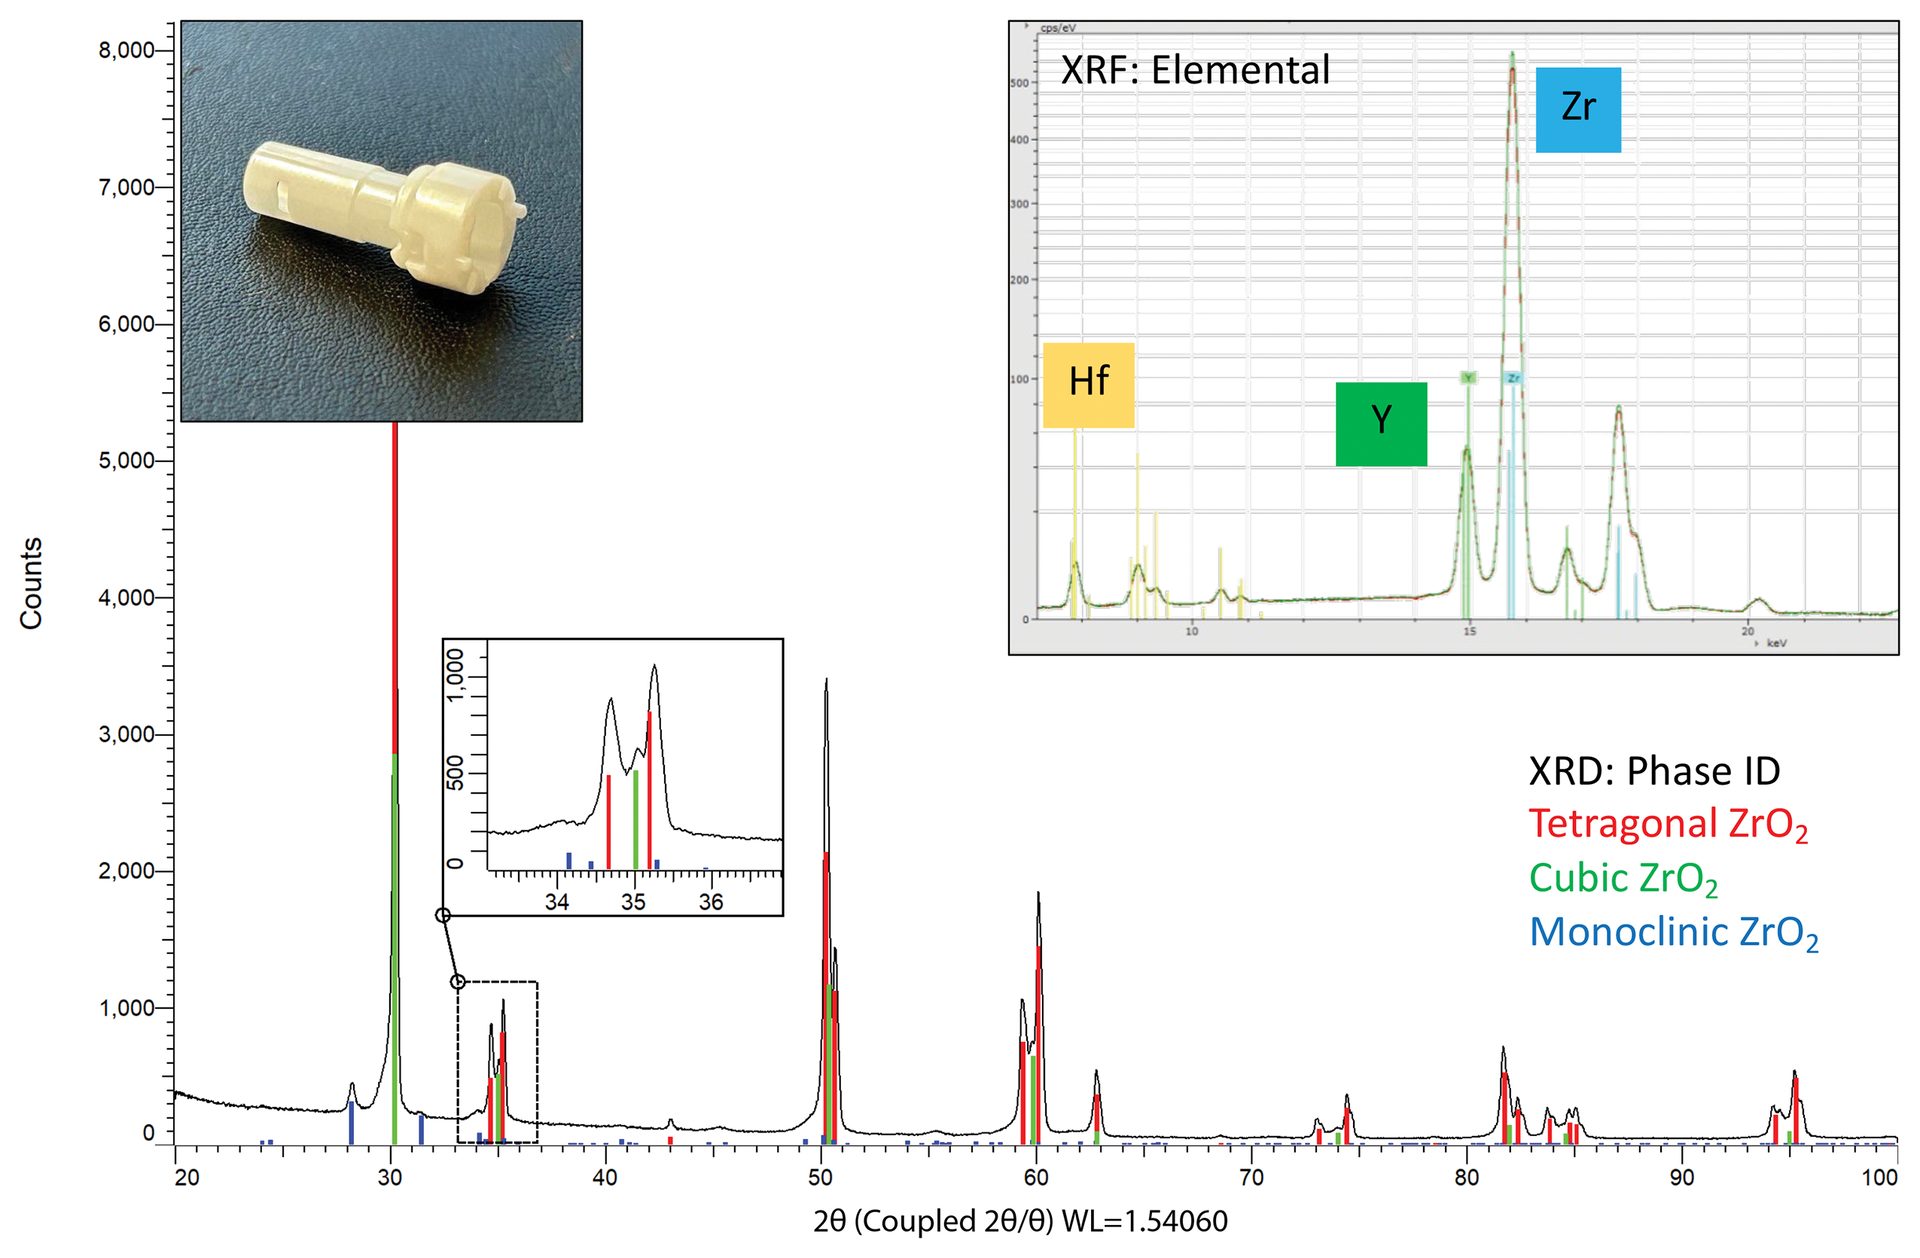
Figure 10. (insets) Elemental analysis of a ceramic fitting. Zirconium (Zr) is identified as the major element with yttrium (Y) and hafnium (Hf) also observed. The spectra from body and head overlay nicely together, indicating a similar overall composition throughout the sample. (main) Diffraction data for the zirconia sample showing the tetragonal main phase with moderate amounts of cubic and some minor/trace monoclinic phases. The stabilization into tetragonal and cubic forms is due to the substitution of yttrium for zirconium. The detection of monoclinic ZrO2 classifies this material as partially stabilized zirconia rather than fully stabilized.
Credit: Henderson, Hill, Sampson, and Sedlmair
No additional peaks are observed in the diffraction data, which rules out any crystalline phases containing silicon, such as quartz or zircon. The silicon detected in the XRF data—possibly added to tailor mechanical surface behavior or optical properties, such as the refractive index4—is then implied to be amorphous.
A small threaded nozzle—off-white in color and with a matte finish—was characterized with joint XRD and XRM studies. The diffraction data confirm that the sample is composed of corundum (Al2O3, alpha phase). A closer inspection at the peak shapes indicates much sharper peaks than the previous zirconia sample. Sharper reflections are an indication of larger crystallites within the sample, which is consistent with corundum behavior with sintering. Spotty diffraction rings (Debye rings) in the 2D data set also indicate the existence of large crystal grains.
An XRM dataset was collected with a Bruker SKYSCAN 2214 equipped with high resolution components, including tungsten filament and CMOS detector. Two primary features are observed in the image slice shown in Figure 11: a small crack on the inner wall and graininess within the sintered oxide body. The speckled appearance is not an artifact but is the result of the large grains that were observed previously in the XRD data. The internal crack is measured with maximum dimensions of 1,014 x 126 x 239 µm (length x width x depth). The diameter of the inner channel is 492 µm at the top opening and about 2,040 µm throughout the main body with some small variations. Visualization as a function of density also reveals a subtle variance between the tip of the nozzle, the wider body, and the threaded base. The tip and base are nearly identical densities and roughly 3% higher than the wider middle region. A flythrough video of this sample (see below) demonstrates the types of visualizations possible with a fully rendered 3D dataset.
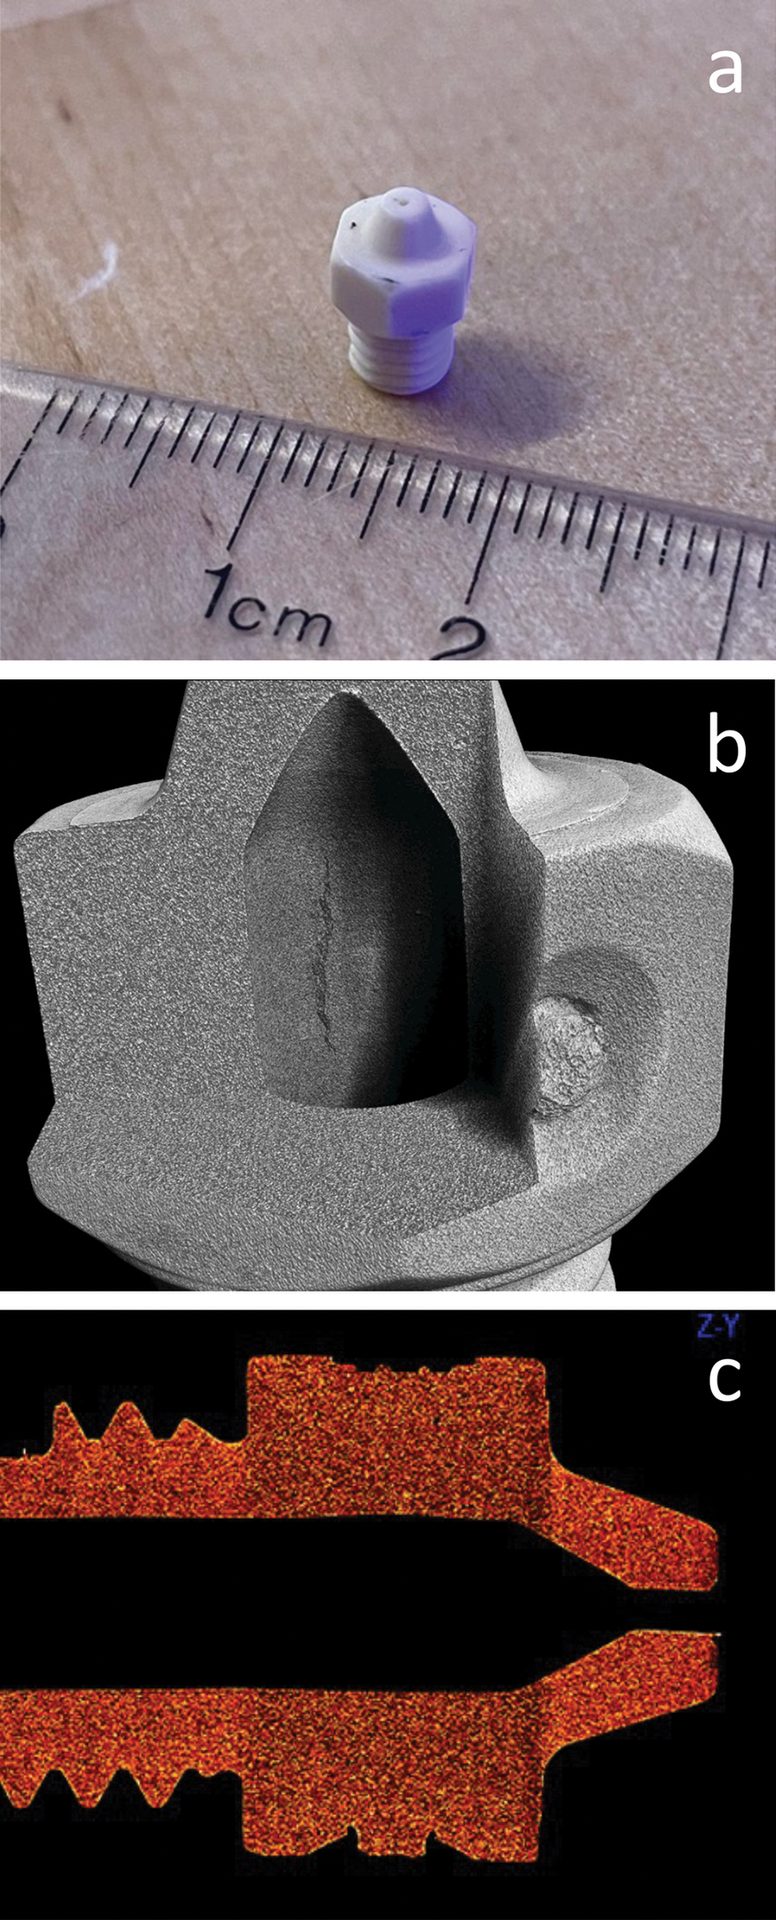
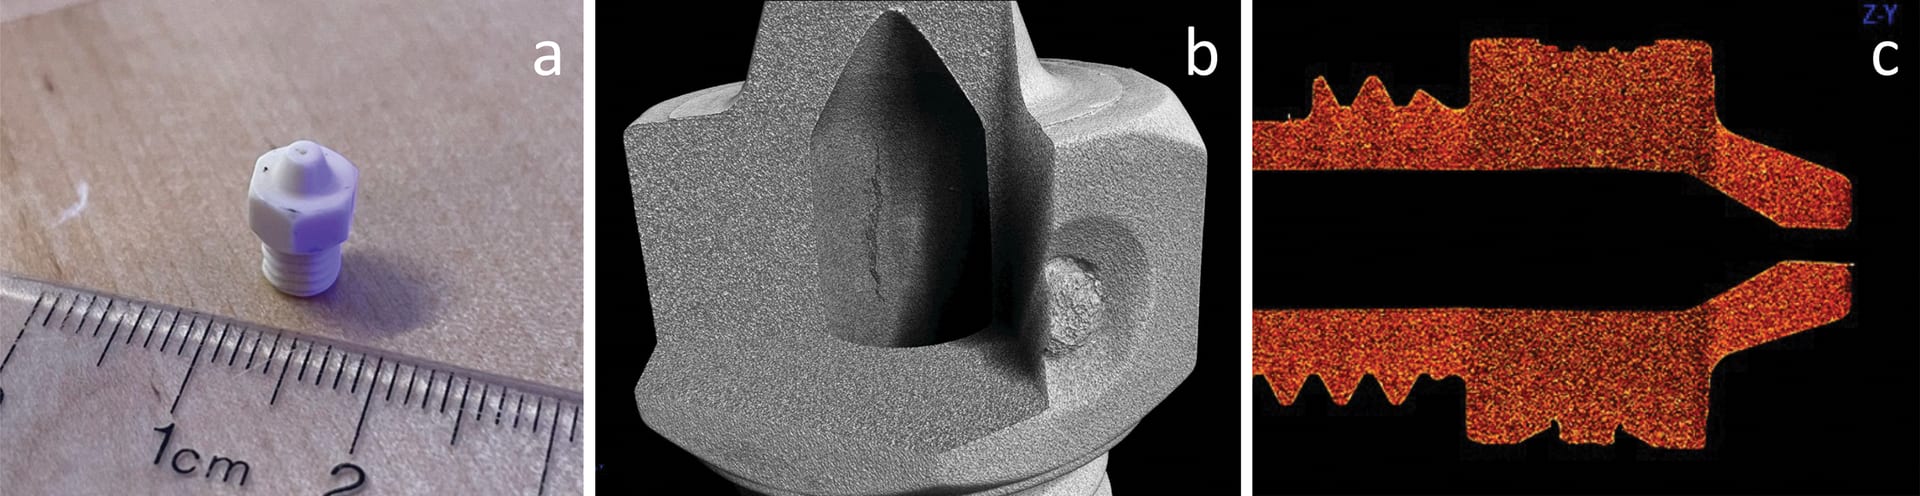
Figure 11. Selected images from an 3D XRM dataset for (a) the alumina nozzle showing (b) a small internal crack on the inner wall of the channel and (c) some observable differences in density between the end, body, and screw regions of the sample.
Credit: Henderson, Hill, Sampson, and Sedlmair
3D dataset collected with a Bruker SKYSCAN 2214 X-ray microscope with CMOS detector at 3 micron voxel resolution. Data reconstruction and visualization performed with 3D.SUITE software package.
Concluding remarks
Each of the highlighted X-ray technologies reveals critically important information in materials characterization: elemental analysis with XRF and µXRF, phase analysis with XRD, and structural analysis with XRM. When used in conjunction, these analytical methods can provide a more complete understanding of a project. Additional educational videos and resources are available here.
About the authors:
Nathan Henderson, Tina Hill, David Sampson, and Julia Sedlmair are senior applications scientists at Bruker Corporation (Madison, Wis.). Contact Henderson.