EMBODIED CARBON
Embodied Carbon in Fenestration
THE BASICS OF EMBODIED CARBON
Embodied carbon is a critical aspect of the total carbon impact of materials in building construction and needs to be carefully considered during the design phase of any new building or retrofit project. While a number of tools are available to quantify whole building embodied carbon, this does not always lead to a better understanding of specific portions of the building such as the fenestration. In this article, we review the basics of embodied carbon and dive deeper into the drivers of embodied carbon in aluminum fenestration systems.
Here are a few quick facts about embodied carbon.
- It refers to all the GHG emissions released during the manufacturing and construction of a building, including raw material extraction, transportation, and fabrication as well as maintenance, replacement, and disposal (Figure 2.1).
- It is responsible for 28% of building sector greenhouse gas (GHG) emissions and 11% of all GHG worldwide.1
It is typically evaluated using a Life Cycle Assessment (LCA), which is a rigorous methodology that quantifies a variety of environmental impacts including global warming potential (GWP).
- Whole building LCAs can be used to assess the embodied and operational carbon impacts of an entire building and all materials used therein, these are complex and time consuming to perform, but provide important data to understand the environmental impact of a building.
- Environmental product declarations (EPDs) use LCA methodology applied to a specific material or product over the initial stages of raw material extraction, material processing, transportation, and manufacturing. This common building materials EPD scope is known as cradle-to-gate, and for fenestration products made of aluminum and glass, this will capture the most energy intensive activities associated with embodied carbon.
- A benchmark study found of 291 office buildings found that the median embodied carbon is 396 kgCO2eq/m² with half of all buildings falling between 266 and 515 kgCO2eq/m².2
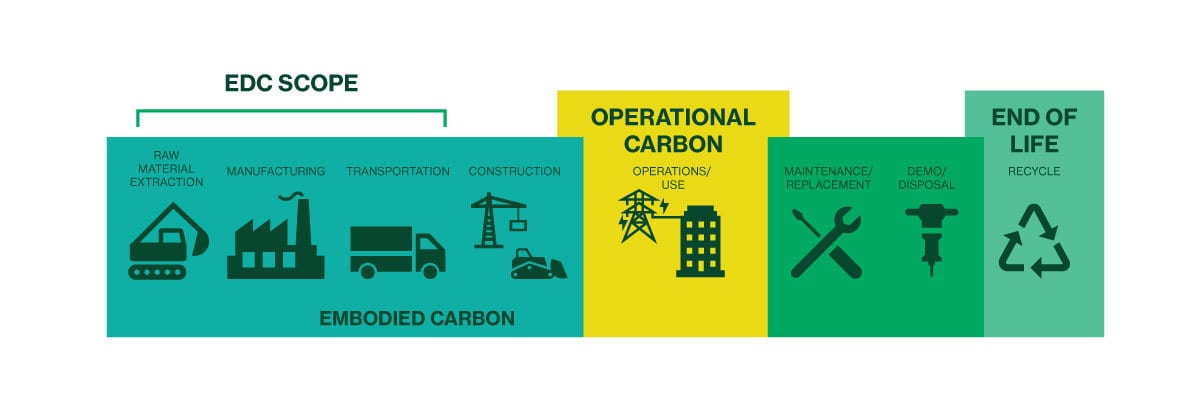
Figure 2.1. Simplified summary of a lifecycle separating embodied carbon and operational carbon phases. The EPD scope is commonly referred to as cradle-to-gate, whereas the entire lifecycle is cradle-to-grave.
THE IMPACT OF ALUMINUM CRADLE-TO-GRAVE
Aluminum framing used in commercial fenestration is a perfect example of a product in which the vast majority of embodied carbon is emitted during the cradle-to-gate stage of the lifecycle. New primary aluminum starts with bauxite mining which is then refined to produce aluminum oxide (alumina). The alumina is then smelted to create aluminum. Approximately 4 to 5 kg of bauxite creates about 2 kg of alumina, producing 1 kg of aluminum. The smelting process requires large amounts of electricity to create pure aluminum and the environmental impact of that process is driven in large part by the electricity source used for smelting. An aluminum ingot smelted using hydroelectricity may have a carbon footprint that is more than four times lower than a process using a coal-fired power plant.In contrast to the smelting process, remelting aluminum only requires about 8% of the energy needed to create a primary ingot. This makes the use of recycled aluminum an effective way to lessen the environmental impact of aluminum framing systems. The Aluminum Extruders Council reports that more than 90% of aluminum used in construction is reused, and unlike plastics can be repeatedly recycled with the same properties as primary aluminum. Conventional wisdom has always dictated using high-recycled content to reduce the environmental impact of aluminum, but the details of any primary aluminum used in the extrusion is very important as well. This information may be captured in a third- party certified EPD from a building products manufacturer.
CALCULATING EMBODIED CARBON FOR FENESTRATION SYSTEMS
To calculate the embodied carbon of a fenestration system we examine a fixed window of 1.48 x 1.23 m, an aluminum frame weight of 16 kg and a dual pane insulating glass unit (IGU) with two lites of 6 mm thick glass weighing 49 kg. For the aluminum frame we use an LCA to calculate the GWP of individual processes contributing to the aluminum framing system and we use representative industry EPDs for the IGU, thermal strut, and gaskets.
Using these specifications, Figure 2.2 shows the relative contribution to GWP from the various components and processes in the final fenestration system product. In this GWP calculation, the primary ingot is transported 9,000 km by container ship and over 2,000 km by truck, and yet transportation still only accounts for 3% of the carbon in the system. Even when including U.S. average 54% recycled content, the aluminum production and finishing account for 62% of the carbon from the system. The aluminum components of the fenestration system represent the biggest carbon footprint and the biggest opportunity for improvement when considering both recycled content and the source of the primary ingot.
For the same recycled content (54%), using primary ingot smelted using hydroelectricity in the aluminum would have a GWP of 2 kgCO2eq/kg but using primary ingot smelted using coal fired electricity in would have a GWP of 14 kgCO2eq/kg. If you focus only on the recycled content, the aluminum GWP can vary by a factor of seven. When you are able to reduce the GWP of the finished aluminum to ~4 kgCO2eq/kg it becomes comparable to the GWP of an IGU.
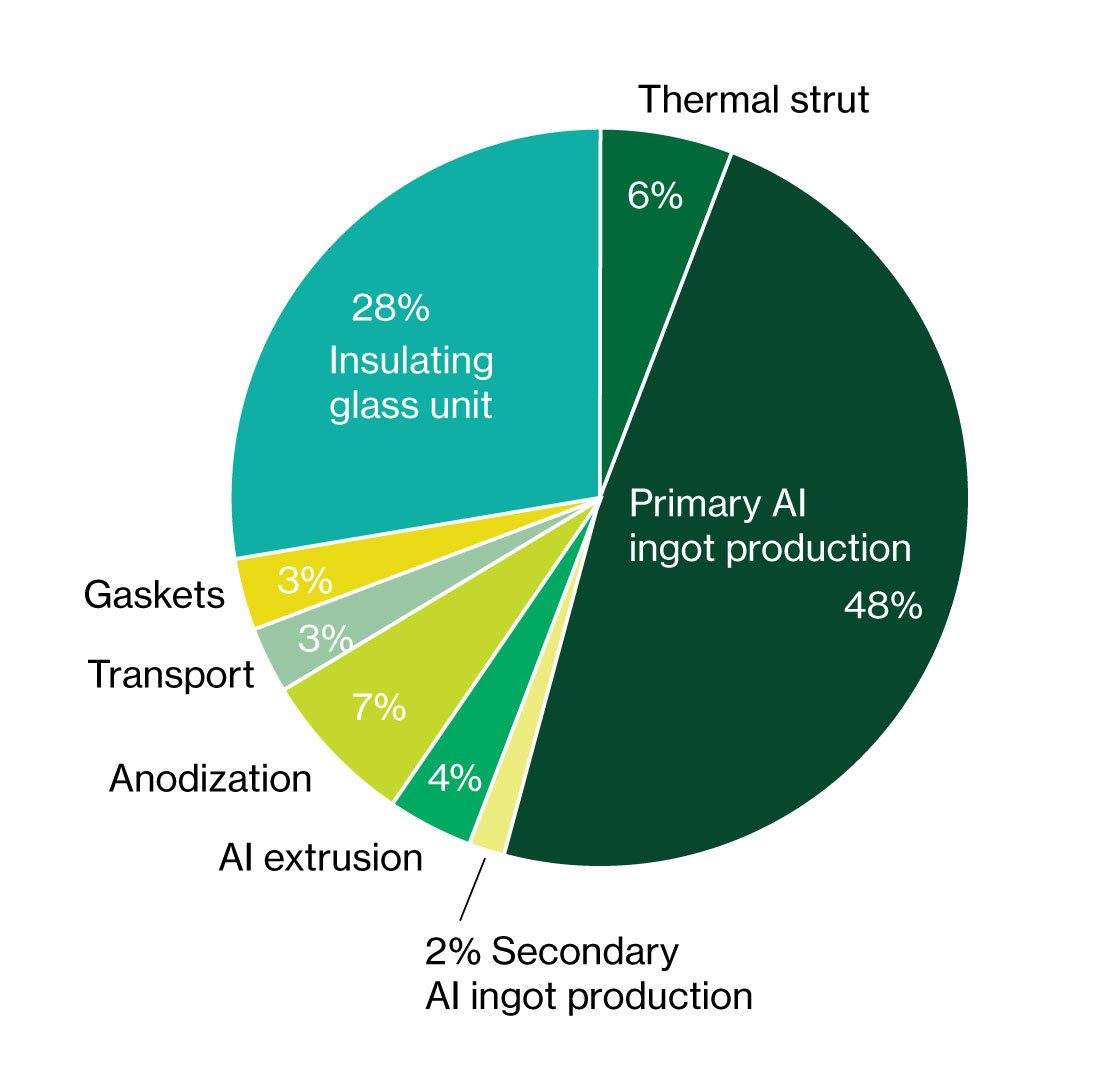
Figure 2.2. Breakdown of contribution to the GWP of model aluminum fixed window product used in this study. Aluminum billet uses the average U.S. GWP of 8.9 kgCO2eq/kg which includes 54% recycled content.5
THE EFFECT OF GLASS SIZE ON EMBODIED CARBON
There is an architectural design consideration that can play an important role in determining the embodied carbon of a fenestration system: the size of windows used. For a fixed total window area, the size of each individual opening will alter the embodied carbon of the system, since it changes the amount of framing used per unit area.
The equation below calculates the embodied carbon of a window (ECwin), where CF is the carbon intensity factor, P is the perimeter, and A is the area.

In this way, the embodied carbon of the frame is dependent upon the perimeter, and the embodied carbon of the glass is dependent upon the area. Because the frame is typically more carbon intensive than the IGU, specifying larger lites of glass will use less aluminum and thus have an overall lower embodied carbon (in the same total area). Figure 2.3 shows how the embodied carbon of the fenestration system changes as the opening height and width changes.
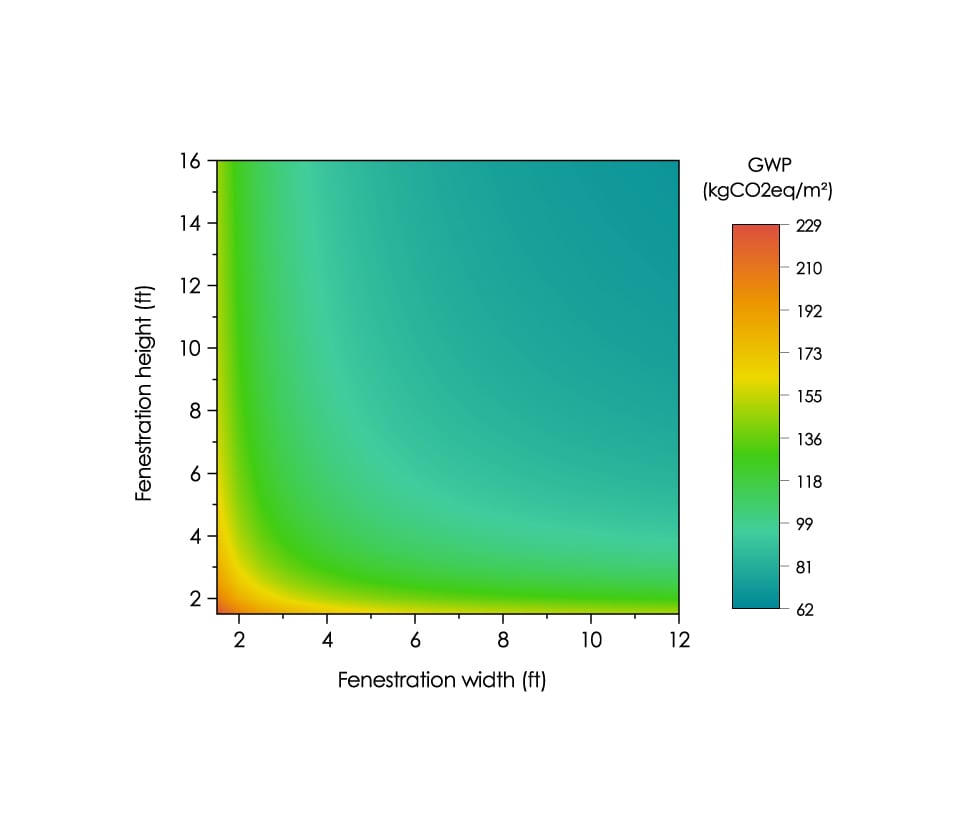
Figure 2.3. Fenestration GWP per unit area as a function of fenestration height and width.
We’ll illustrate a simple example for an area of 4’ x 8’ (1.2 x 2.4 m). Using two 4’ x 4’ (1.2 x 1.2 m) windows results in embodied carbon of 117 kgCO2eq/m² but if you instead use a single 4’ x 8’ window the embodied carbon is reduced to 99 kgCO2eq/m². This simple design decision saves 17% embodied carbon, and the savings can be more pronounced when factoring in even smaller window sizes. Wherever possible minimizing the framing perimeter required for the same fenestration area will reduce the embodied carbon of the system. An important note is that this relation holds true for a given frame dimension and glass thickness – if increasing the daylight opening dimensions necessitate deeper mullions or thicker glass, this must be taken into account in the comparison. A building products manufacturer should be able to assist in optimizing the fenestration design for given openings.
In our analysis we use 1.5 x 1.2 m fixed windows and calculate the embodied carbon to be 130 kgCO2eq/m² per window area (652 m²). The medium office building considered here has a 33% window to wall ratio and a floor area of 4,982 m², thus the fenestration embodied carbon is 17 kgCO2eq/m² of floor space. This represents 3 to 6% of the total building embodied carbon of the building based on the previously mentioned benchmarking study, however this number can vary significantly as the window to wall ratio or carbon footprint of fenestration changes. In this article we discussed how the embodied carbon of an aluminum fenestration system can vary dramatically and is primarily driven by the details of the aluminum used. Choosing a fenestration system that uses aluminum with high recycled content and low carbon primary billet is the biggest step a designer can take to minimize the footprint of the fenestration, although window geometry and glass thickness can also play a role. Through EPDs, fenestration design, and working with building products manufacturers an architect can calculate the embodied carbon of a building and evaluate options to minimize it.
As we discuss in the next article, it is often best to include information about both the embodied and operational carbon of the system when making choices to reduce carbon footprint.
1 Embodied Carbon, International Codes Council: https://www.iccsafe.org/advocacy/embodied-carbon/ Accessed March 9, 2022
2 Simonen, K., Rodriguez, B., Barrera, S., Huang, M., (2017) CLF Embodied Carbon Benchmark Database, database. Available at http://hdl.handle.net/1773/38017.
3 Milovanoff, A., Posen, I. D., & MacLean, H. L. (2021). Quantifying environmental impacts of primary aluminum ingot production and consumption: A trade‐linked multilevel life cycle assessment. Journal of Industrial Ecology, 25(1), 67-78.
4 “How Does the Aluminum Extrusion Industry Impact the Environment?” (2022) Aluminum Extruders Council, https://www.aec.org/page/aluminum-extrusion-sustainability
5 (Aluminum Extruders Council (AEC), (2016a). Environmental Product Declaration - Aluminum Extrusions. UL Environment. Retrieved from https://cdn.ymaws.com/www.aec.org/resource/resmgr/Sustainability/101.1_AEC_EPD_Aluminum_Extru.pdf