EMBODIED CARBON
Total Carbon & Embodied Carbon Percentage
A Complete Look at the Impact of Fenestration Systems
Through a more detailed understanding of the operational and embodied carbon components of a fenestration system, architects may make better decisions to reduce the total carbon footprint of fenestration and the entire building design. The best strategies will be both comprehensive and detailed. A wholistic approach includes detailed analysis of both embodied carbon and operational carbon through methods like whole building life cycle assessment) and combines tools such as embodied carbon calculators with building energy modeling.
In this article, we combine our calculations of embodied carbon and operational carbon for our model of a medium office building and the aluminum fenestration system to examine the regional variation in carbon footprint makeup to understand the cumulative lifetime carbon emissions of new buildings as well as those with window retrofits. As discussed in the previous article we are looking at the portion of operational carbon attributed directly to the fenestration system based on heat loss and gain through the window at a state-by-state level using site-specific fenestration specifications, climate, and electricity grids. We also examine geographic variations in the embodied carbon percentage, where embodied carbon percentage is the embodied carbon (cradle-to-gate) divided by the total carbon (embodied plus operational).
Please refer to the previous articles (Operational Carbon in Commercial Fenestration and Embodied Carbon in Fenestration) for more details on the specifics of the calculations for operational carbon and embodied carbon.
CUMULATIVE CARBON EMISSIONS
For a deeper look at the total carbon footprint of fenestration systems, we look at two locations: Buffalo, New York (climate Zone 5A) where the energy consumption is heating dominated and Tucson, Arizona (climate Zone 2B) where the energy consumption is cooling dominated. The model building has 4900 m² of floor space with a window to wall ratio of 33%. The 2019 model code specifies fenestration U-factor = 2.0 W/m²-K (0.35 Btu/hr-ft²-°F) and solar heat gain coefficient (SHGC) = 0.38 for Zone 5A and U-factor = 2.6 W/m²-K (0.46 Btu/hr-ft²-°F) and SHGC = 0.25 for zone 2B.
Building simulations show a similar amount of annual energy usage for the fenestration system in both locations (40 kWh/m² for Buffalo, and 39 kWh/m² for Tucson), however, the carbon intensity of the grid in Arizona is 56% higher compared with New York resulting in an increased operational carbon footprint. When a building is initially built, its carbon footprint is completely based on the embodied carbon―all the greenhouse gases (GHG) it took to build.
Each year new carbon is emitted from electricity and fossil fuel consumption, increasing the operational carbon, and shifting the embodied carbon percentage lower. After 30 years of operation, the embodied carbon will account for 37% of the total emissions for Buffalo and 26% for Tucson. The profile of cumulative total carbon emissions for the Arizona building is shown in Figure 3.1 along with how the percentage of embodied carbon will change throughout a 30-year period. The lifetime of the fenestration system is a critical aspect of the carbon footprint and embodied carbon percentage, but it cannot always be well determined at the time of building design. For example, if the fenestration system considered here had a 50-year lifetime, the embodied carbon percentage is reduced to 18% because of the additional 20 years of cumulative operational carbon.
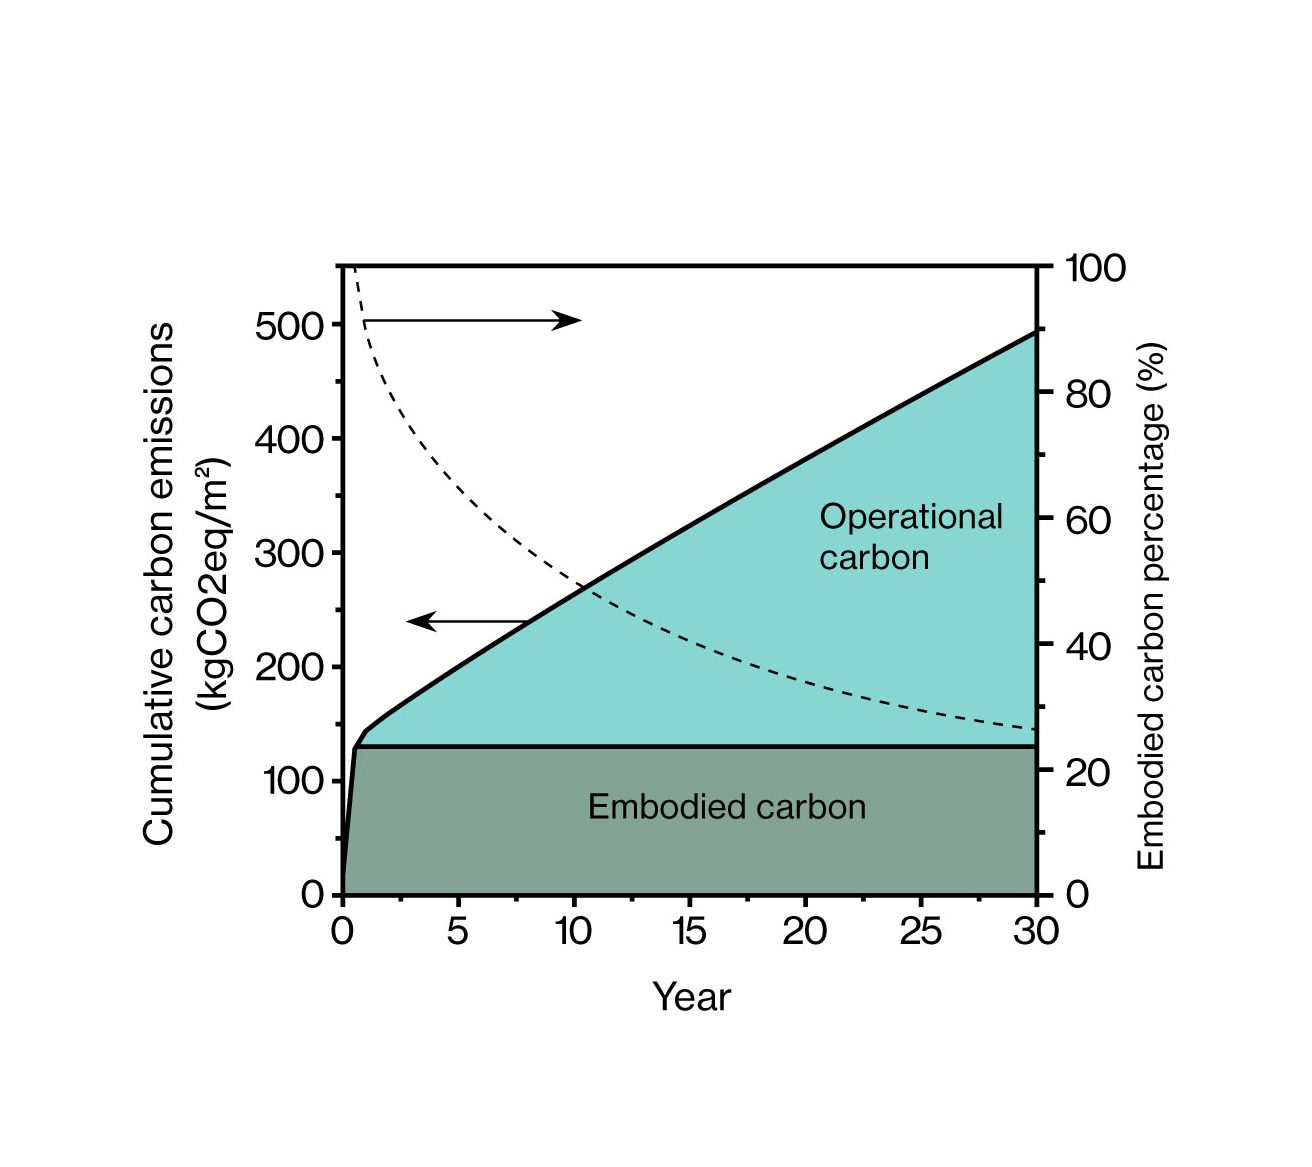
Figure 3.1. Cumulative CO2 emissions from manufacturing (“Embodied”) and use (“Operational”) phases of fenestration system for the American Society of Heating, Refrigerating, and Air-Conditioning Engineers (ASHRAE) medium office building in Tucson, Arizona. The CO2eq emissions are normalized by the total window area (650 m²). Embodied carbon emissions are all attributed to year zero of a building while operational carbon slowly accumulates over the building lifetime. The solid line represents the cumulative carbon emissions while the dashed line represents the embodied carbon percentage.
EMBODIED CARBON PERCENTAGE
Historically, operational carbon has far outweighed the embodied carbon of typical buildings due to the poor energy efficiency and the carbon-intensive electric grid in the U.S. Now with more efficient HVAC, higher performing windows, and LED lighting along with a cleaner grid, the embodied carbon can comprise a significant portion of the total building carbon footprint. However, the percentage can still vary widely based on the local climate, specific building performance, electric grid, along with the building materials used. To examine how this can change regionally, we can combine state-by-state operational carbon information with the averaged embodied carbon (Figure 3.2).
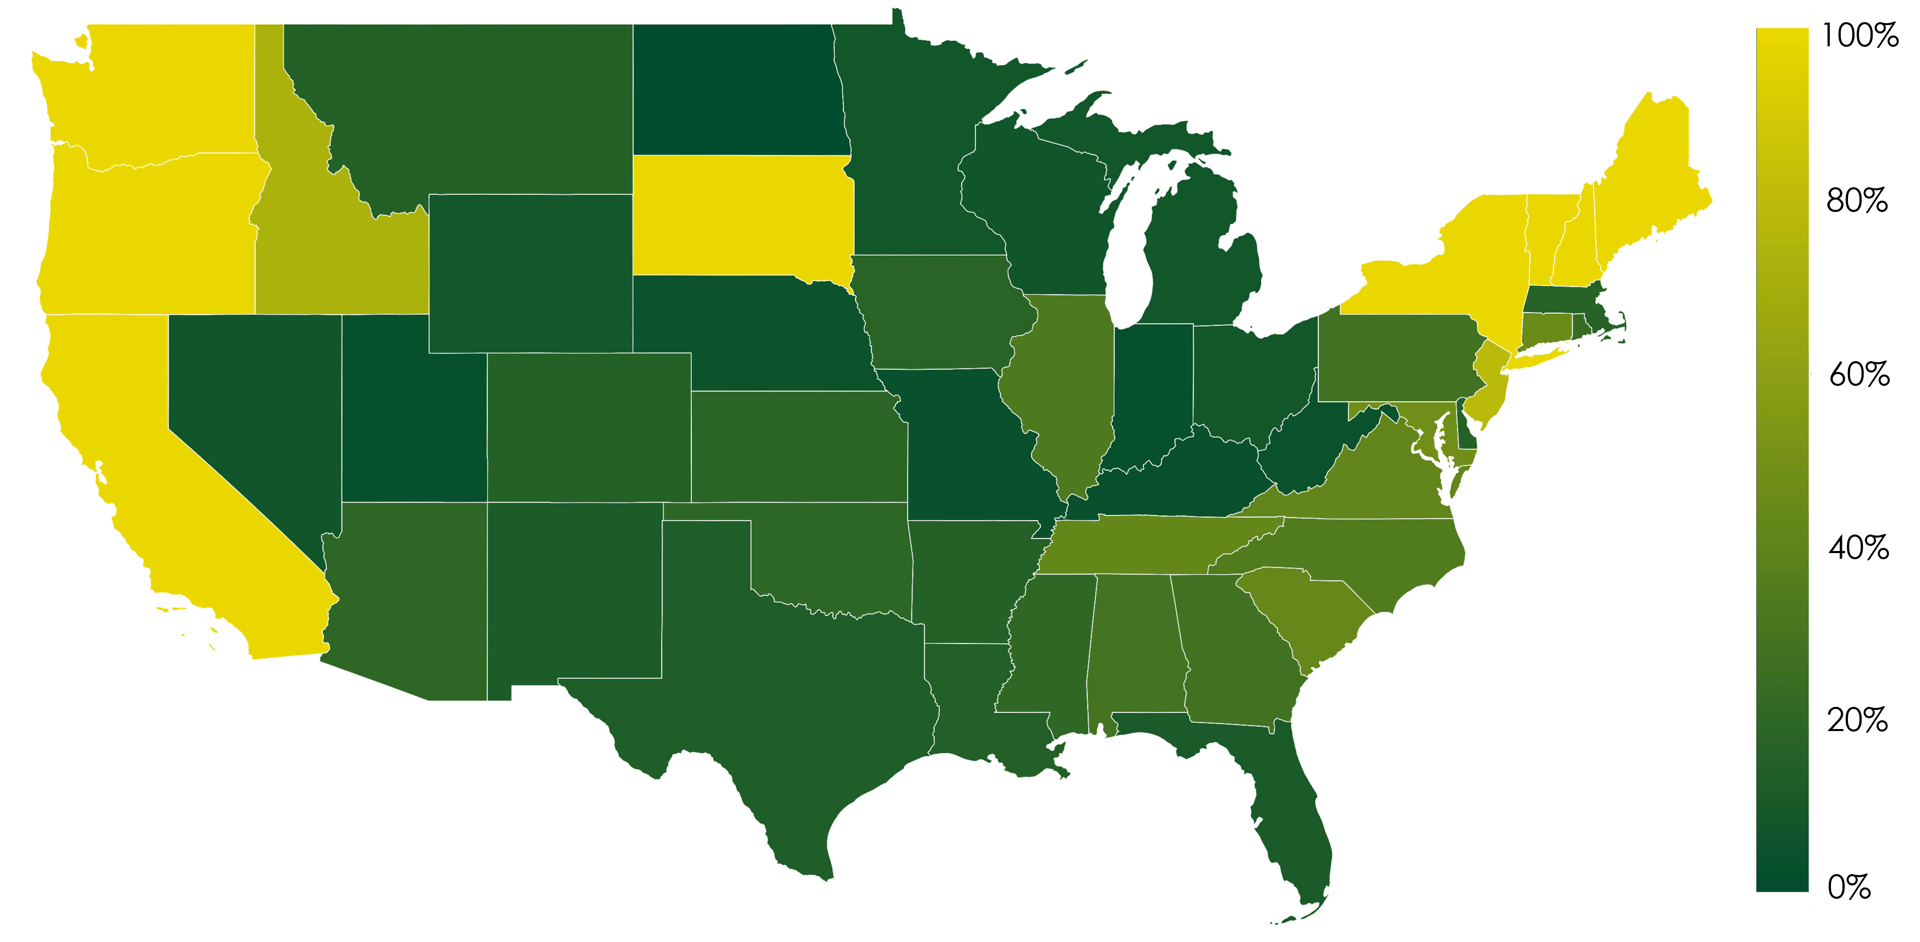
Figure 3.2. Estimated embodied carbon percentage by state where Embodied carbon percentage = Embodied carbon / (Embodied carbon + Operational carbon). Embodied carbon remains constant and operational carbon is calculated as shown in Figure 1.2. Operating carbon is cumulative over 30 years.
There is a clear geographical concentration of areas with high embodied carbon percentage in the West and Northeast U.S., which coincides with the regions with the lowest carbon electrical grids (Figure 1.2). An important note is that this analysis uses the ASHRAE 90.1 2019 model codes, so it will not include the influence of enacted state code levels. Many of the states with the least stringent enacted codes are those that already show low embodied carbon as a percentage. An analysis using enacted codes would show higher operational carbon in those states driving the embodied carbon percentage lower. In all, there are eight states where the fenestration embodied carbon percentage is 95% or higher, but otherwise the vast majority (70%) have an embodied carbon percentage below 40%.
This study uses a dual pane IGU; introducing advanced glazing products such as triple pane IGUs, vacuum insulating glass (VIG), or electrochromic glass will increase the embodied carbon percentage of the system. Often times these advanced glazing systems will pay pack the higher initial investment in embodied carbon through the reduction in operational carbon over its lifetime.
While any building design should strive to reduce both embodied carbon and operational carbon, understanding the relative amount of each can be useful for a designer to know where to primarily focus efforts. For example, a project in the state of Washington (electricity carbon intensity 103 kgCO2/MWh) is better served to specify an aluminum framing system with a high-recycled content or certified hydro smelting. In contrast, in portions of the Midwest U.S., the biggest carbon reductions will be achieved through high thermal performance fenestration systems. This is not to suggest that embodied carbon and operational carbon cannot be reduced simultaneously, but accurate data regarding the relative contributions can improve design and decisions.
CARBON PAYBACK FOR RETROFITS
One of the most effective ways to reduce the environmental impact of the built environment is to reuse and renovate buildings rather than building new where possible. An analysis of the whole building carbon comparison for new versus renovated is beyond the scope of this article, but we will demonstrate how this can be viewed specifically for a fenestration system. We turn back to our medium office building in Buffalo and Tucson. Let’s suppose we are examining a 30-year-old building and want to know the impact of retrofitting the fenestration. If the original windows conform to the ASHRAE 90.1 1989 code and the new windows comply with the 2019 version of the code, we can look at the energy consumption savings with the new windows and translate that into carbon savings to determine how quickly we can offset the embodied carbon of a new fenestration system and what type of lifetime savings can be achieved. We look at a range of embodied carbon with a low carbon (90 kgCO2/m2) and a high carbon (270 kgCO2/m2) fenestration system retrofitted in both Buffalo and Tucson.
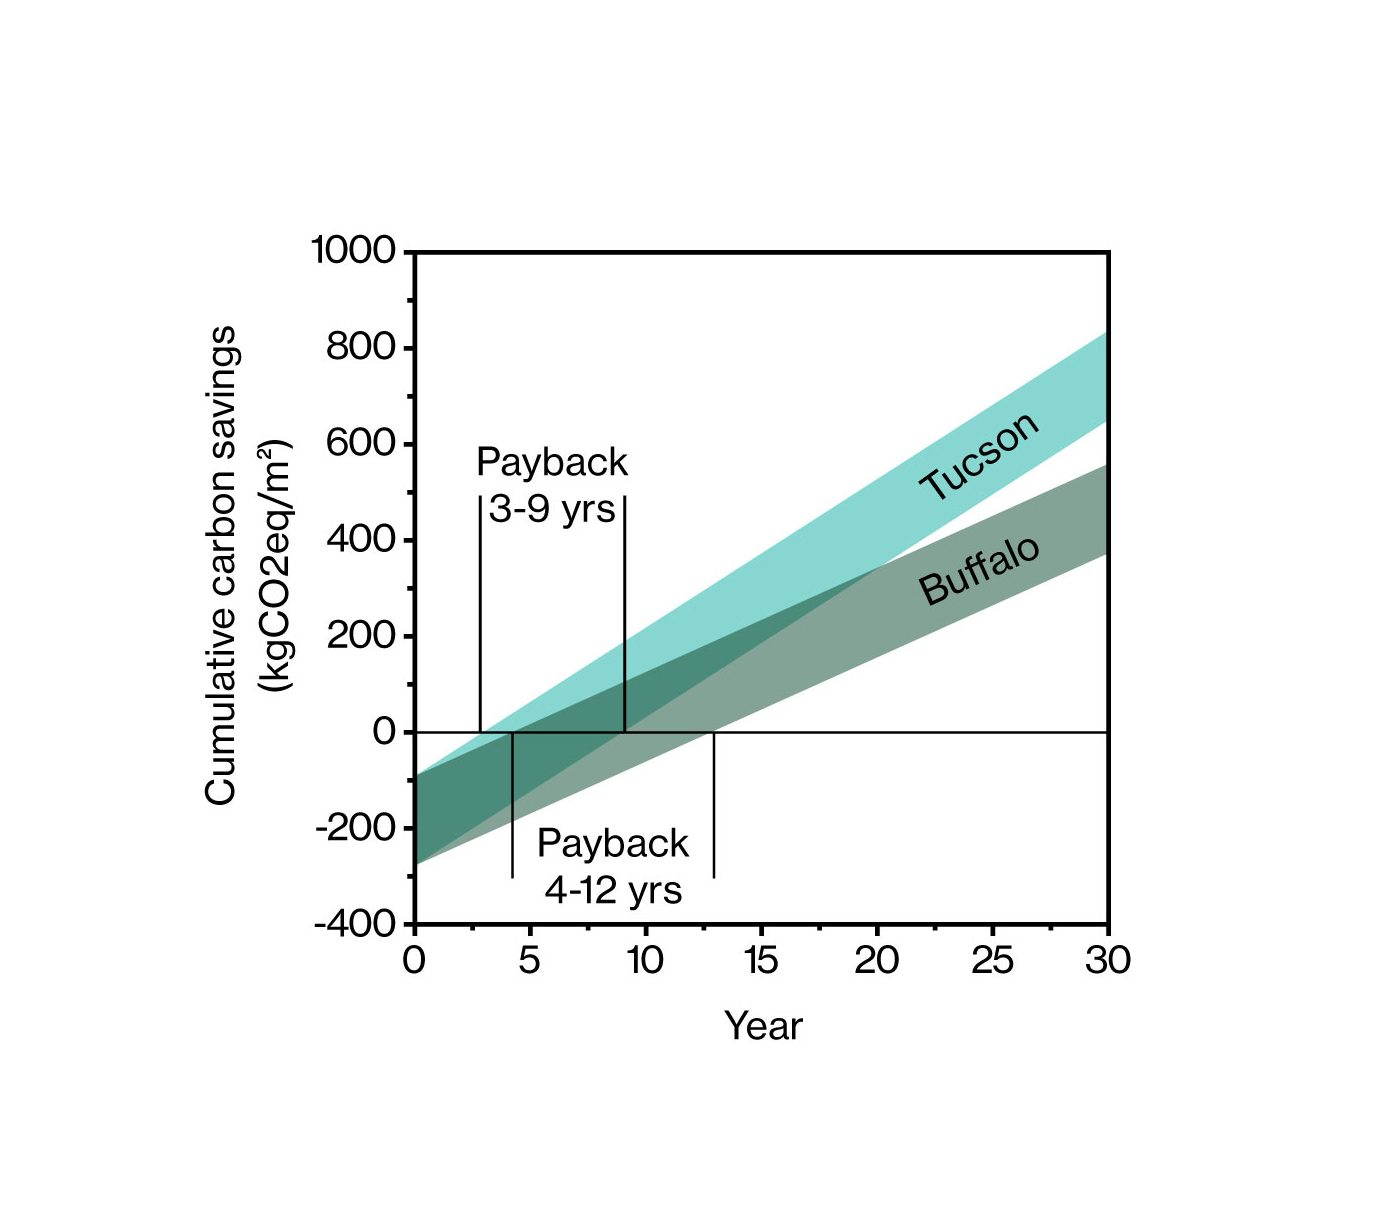
Figure 3.3. Cumulative carbon savings from replacement of 30-year-old windows in Tucson, Arizona (climate Zone 2B) and Buffalo, New York (climate Zone 5A). Carbon payback period is 3-9 years in Tucson and 4-12 years in Buffalo, when operational carbon savings has offset the embodied carbon from the new window system. The shaded region represents a range of paybacks based on different starting embodied carbon values. The CO2eq emissions are normalized by the total window area (650 m2).
Figure 3.3 shows the range of cumulative carbon per year starting with a large negative carbon investment in the embodied carbon of a new fenestration system. The annual energy savings in both locations is approximately 100 kWh/m² (per unit fenestration area), but the carbon savings is slightly higher in Tucson due to the higher carbon intensity of the grid in that location. In the case of the low embodied carbon fenestration system, the payback can be as little as 3 years in Tucson and 4 years in Buffalo with the upper range of 9 and 12 years, respectively depending upon the specific embodied carbon of the retrofit system. The total lifetime savings over 30 years would be 600 tonnes CO2eq in Tucson and 420 tonnes CO2eq in Buffalo; with an 85 tonne CO2eq initial spend in embodied carbon this comes out to a return on investment of 700% and 500%, respectively. This demonstrates that significant benefits in GHG reductions can be achieved despite upfront embodied carbon emissions for fenestration retrofits. Each retrofit should be analyzed carefully with site specific information to determine the anticipated carbon savings for the project.
The following parameters affect the total carbon footprint and embodied carbon percentage and can vary dramatically:
Primary Al ingot source, Al recycled content, fenestration U-factor, solar heat gain coefficient, window geometry, site-specific weather, and building electricity carbon intensity.
CONCLUSION
It is important for architects and engineers to understand that there is not a general rule of thumb that applies when considering the embodied carbon content of a commercial aluminum fenestration system. It is critical that any building designer motivated to reduce carbon emissions understands the specific situation related to the building and fenestration specified in question to make informed decisions. Understanding the predicted building energy consumption and carbon intensity of the heating and cooling systems is vital, along with the embodied carbon of the aluminum framing system. The operational carbon is driven by the performance specifications of the fenestration, carbon intensity of the heating and cooling systems, and local weather. The embodied carbon is driven by the aluminum recycled content and source of primary billet along with the ratio of framing to glass. When a holistic view of the manufacturing and use phase of an aluminum fenestration system is considered it is possible to minimize both operational and embodied carbon in a way that provides the best environmental benefit.
If you would like to evaluate the thermal or visual performance of a fenestration system, click here . Specialists at OBE can work with you to calculate and optimize the carbon footprint of the fenestration system on your next job. Please reach out to us at carbon@obe.com to learn more.