EMBODIED CARBON
Operational Carbon in Commercial Fenestration
INTRODUCTION
It is well known that the built environment is responsible for approximately 40% of global greenhouse gas emissions, but the best path forward for reducing its impact is not always obvious. The tradeoff between choosing energy efficient new construction or retrofitting existing building stock can be complicated and involves a balance of operational carbon versus embodied carbon.
Operational carbon refers to all the greenhouse gases emitted because of a building’s energy use, including electricity and direct fossil fuel consumption. Reducing operational carbon has been the focus of energy efficiency efforts for decades and includes the development of more efficient HVAC systems, LED lighting, better building envelope insulation, smart building controls, and high-performance fenestration. As the operational carbon of buildings has continued to decrease, the embodied carbon has become a greater concern for carbon reduction efforts.
Embodied carbon refers to the greenhouse gases emitted in the process of building construction that includes raw material extraction, transportation, and manufacturing of building materials. In some cases, the embodied carbon can account for more than half of the total carbon footprint of a commercial building over its lifetime, however, this can vary dramatically depending on a building’s energy mix, design, and material sources.
There can also be a large difference in how the building subsystems contribute to operational and embodied carbon. By examining and optimizing the carbon footprint of building subsystems, architects can aim to reduce the whole building carbon footprint and break down the problem to more manageable levels.
In these articles, we attempt to explain and quantify the carbon footprint specifically due to the fenestration system. We explain and calculate the main contributors to operational and embodied carbon of fenestration products along with practical information that can help lessen the impact of fenestration systems on a new building. We’ll also look at how to assess the impact of window retrofitting and calculate the carbon payback of replacement windows.
What do we mean by carbon footprint?
This refers to the total greenhouse gas emissions (GHG), quantified as the global warming potential (GWP) which is a standard environmental impact used in life cycle assessments (LCAs). The units are typically kgCO2eq where all GHGs are converted to an equivalent of carbon dioxide emitted based on the global warming potential of the gas.
OPERATIONAL CARBON FOOTPRINT IN FENESTRATION
The operational carbon of a building results from energy consumption of the HVAC system, water heating, lighting, plug loads, and possibly refrigeration and is also affected by passive building elements such as windows, walls, roofs as well as natural ventilation and thermal mass. The specific energy consumption and operational carbon associated with fenestration is less obvious, since it is not a system that directly consumes electricity or fossil fuels. To understand how the fenestration system contributes to energy consumption, we must isolate and calculate the heat loss and heat gain from the fenestration system and then attribute that portion of the HVAC energy consumption. This step of energy attribution is critically important because it lets us separate and study the fenestration system and assess how changes to fenestration can affect carbon in a way that is not tied to a particular building design or a specific level of opaque insulation, HVAC system, etc. While there are too many variables to develop any simple rule of thumb, the following case study can provide insights on how general fenestration systems can be optimized for carbon footprint and energy consumption―learnings that can be applied to a range of projects.
MODELING THE ENERGY CONSUMPTION OF FENESTRATION
Quantifying the energy consumption of an air conditioner or light bulb is easy, we can measure or calculate the electricity needed to power it for given periods of time. With a window or curtain wall, there is no electricity or natural gas supplying it that can be quantified. The energy consumption due to a window is attributed to the net change in energy consumption the heating, air conditioning, and ventilation system requires to adjust to heat transfer from the fenestration.
In some cases, this can be unwanted heat transfer that requires additional energy from the HVAC system; in other cases, the heat transferred through windows can reduce the energy consumption of the HVAC. If for an entire year, the total HVAC energy consumption is less as a result of the fenestration, we would then consider that fenestration system to have a negative operational carbon footprint.
To calculate the energy attributed to fenestration, we must calculate the energy consumed by the HVAC with the fenestration system of interest (e.g., the standard U-factor and solar heat gain coefficient) and then calculate the energy consumed by the HVAC with no heat transfer across the fenestration area. The difference between the HVAC energy in these two cases is the energy consumption (or savings) due to the fenestration.
CASE STUDY
Throughout these articles we use a single concept to model energy consumption and carbon footprint: a generic fixed window product in a medium office building modeled with different thermal performance, aluminum sources, frame size, weather, and electricity mix too examine how the footprint can change with design and geography. We look at the energy consumption and operational carbon per unit fenestration area to minimize the effect of building size and window to wall ratio. Building energy consumption is simulated using EnergyPlus (version 9.6) software with an American Society Heating, Refrigerating and Air-Conditioning Engineers (ASHRAE) 90.1 model Medium Office Building set to the 2019 code standard (Prototype Model Buildings, 2021).
THE EFFECT OF CLIMATE ZONE AND FENESTRATION SPECIFICATIONS ON ENERGY CONSUMPTION
We first examine how the fenestration thermal properties affect energy consumption in different climates by performing a detailed set of building simulations in the U.S. cities of Buffalo, New York and Tucson, Arizona to mimic a heating and cooling dominated climate, respectively. The details of the building and climate are listed in Table 1.
In a cooling dominated climate such as Tucson (Zone 2B) the annual fenestration energy consumption is most impacted by the solar heat gain coefficient (SGHC)―quantifying the thermal radiation from the sun passing through a window (Figure 1.1a) while in a heating dominated climate such as Buffalo (Zone 5A) the U- factor―quantifying the thermal insulation―will have the biggest impact on the energy consumption (Figure 1.1b). The medium office building uses natural gas as the primary source of energy for heating and electricity for cooling. It is interesting to note that when using the 2019 model code, the energy consumption of the fenestration in Buffalo and Tucson are within 4% of each other indicating that the ASHRAE 90.1 designated U-factor and SHGC values are working well in this case to create similar energy consumption in very different climates.
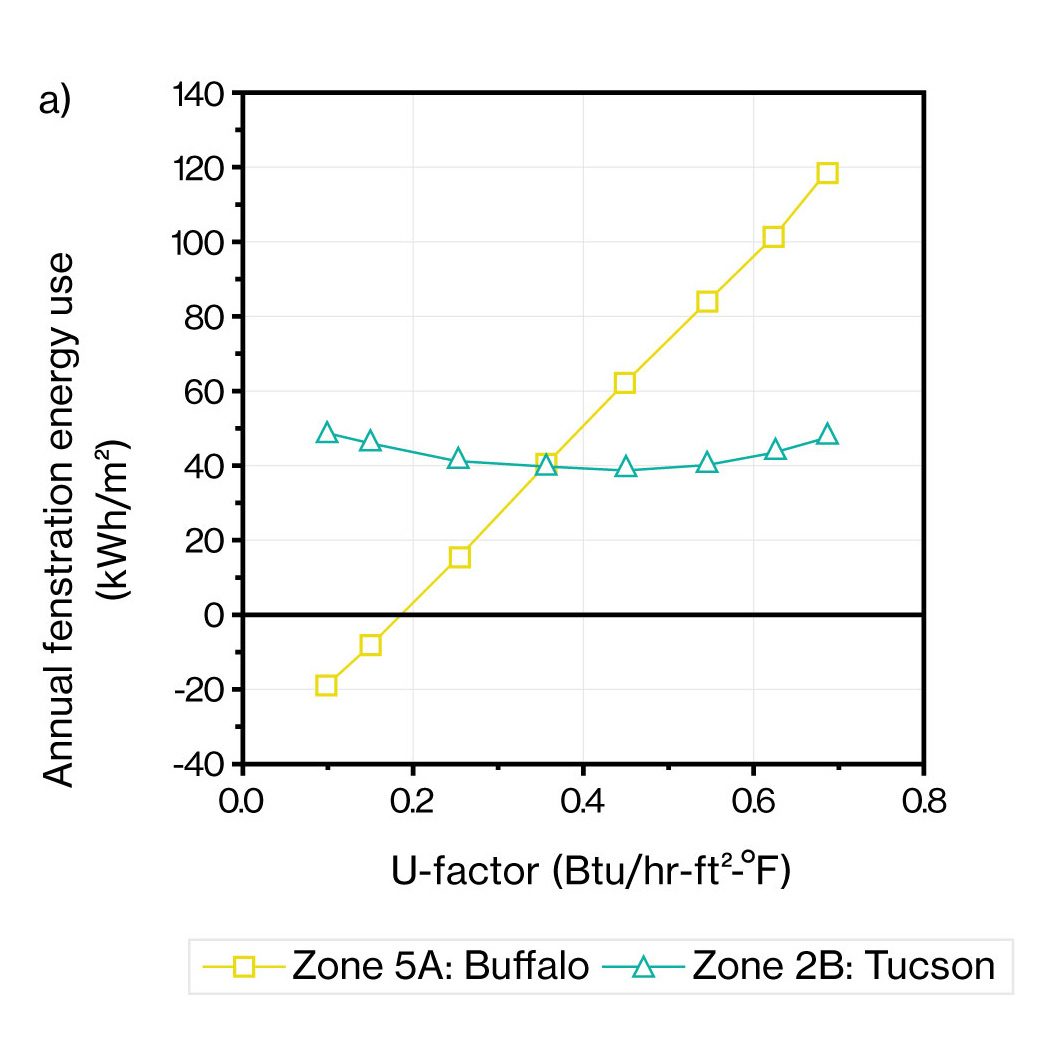
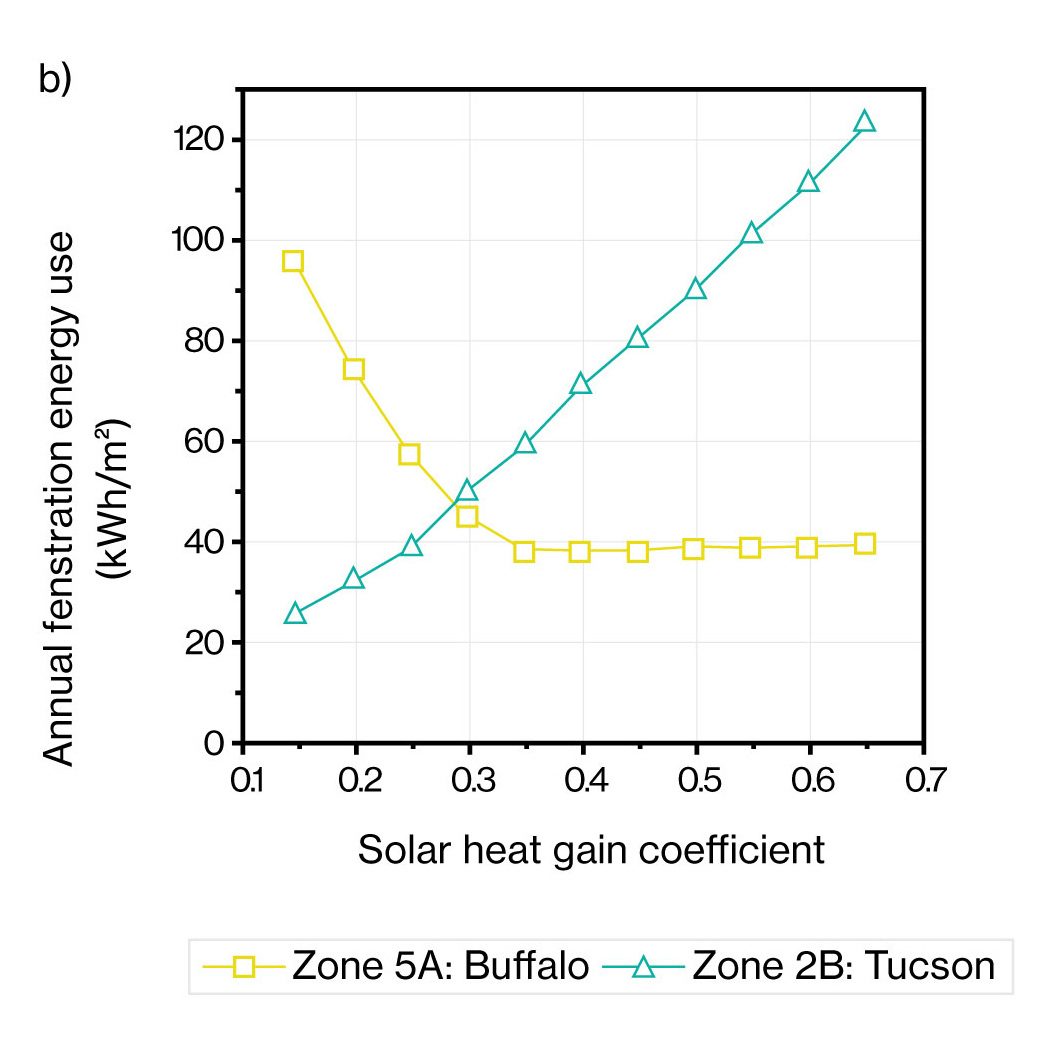
Figure 1.1. Annual HVAC energy consumption of ASHRAE Medium Office model building versus a) fenestration U-factor and b) SHGC for Buffalo, New York (climate zone 5A) and Tucson, Arizona (climate zone 2B). The energy is normalized by the fenestration area.
The fenestration energy consumption becomes negative as the U-factor drops below ~1 W/m²-K (0.2 Btu/hr-ft²-°F), which is a high insulation value. In this case, the benefits from solar heating in the cold winter outweigh any heat losses through the window or unwanted solar heat gains in the hot summer. This demonstrates that if the U-factor of the fenestration is low enough in this climate, the fenestration system provides net energy savings to the building resulting in a negative operational carbon footprint. This is an important concept for building design – the most energy efficient building is not always created by minimizing fenestration area – in certain regions increasing the area of the right fenestration system can improve a building’s energy efficiency.
THE CARBON INTENSITY OF THE ELECTRICAL GRID
The carbon intensity of the electric grid in the U.S. varies greatly depending on the source employed by a given utility, hydroelectric power, wind, solar, natural gas, nuclear, and coal. A building’s electricity supply plays a large role in its carbon emissions and the operational carbon of the fenestration system. For example, the state of Washington primarily uses hydroelectric dams for its power and has an average carbon intensity of 103 kgCO2/MWh (Figure 1.2), while Wyoming uses coal to generate most of its electricity and has nine times higher carbon intensity (892 kgCO2/MWh). The national average for the U.S. in 2019 was 400 kgCO2/MWh and according to the Energy Information Association (EIA) is projected to decrease to 300 kgCO2/MWh by 2050 (Annual Energy Outlook 2021).
When we model the operational carbon of fenestration over 30 years, we apply these changes in electricity. It is important to note that electricity generation and carbon intensity varies with local providers and utilities and is not constant for an entire state, however this averaged data provides a good representation of geographical variability in the carbon intensity of the U.S. grid.
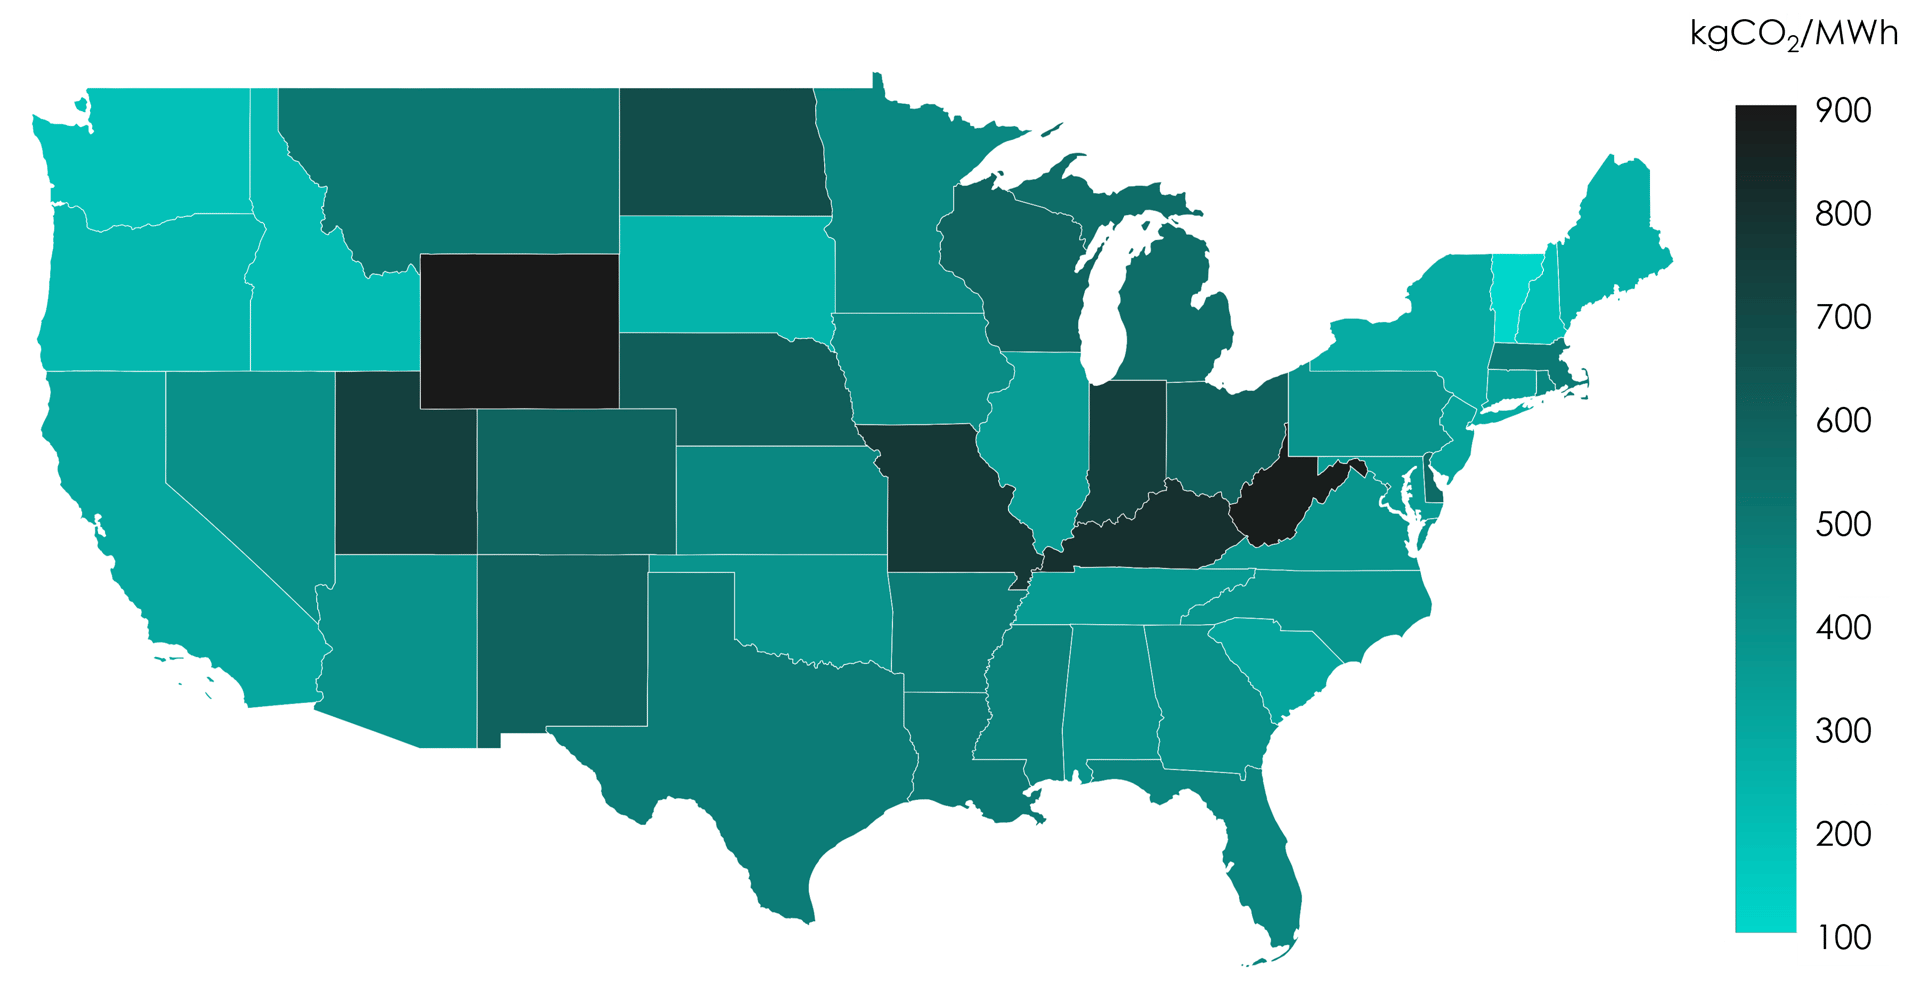
Figure 1.2. Carbon intensity of electricity supply for various states in the U.S. used in this study (U.S. Energy Information Administration, 2021)
THE REGIONAL VARIABILITY OF OPERATIONAL CARBON
To assess the regional variation of operational carbon, we use local weather in each state along with the model fenestration specifications (ASHRAE 90.1 2019) for the local climate zone in conjunction with the average carbon intensity for electricity in each state. The operational carbon of the fenestration varies dramatically with six states over 1,000 kgCO2/m² (North Dakota, West Virginia, Kentucky, Indiana, Missouri, Utah) and eight states at or below zero (Washington, Oregon, Vermont, New Hampshire, Maine, California, New York, South Dakota). This most commonly occurs in northern regions where solar heat gain in the winter can reduce natural gas consumption, and the electricity grid has low carbon intensity and thus a smaller footprint for summer cooling. It is well understood that under the right conditions and specifications, a fenestration system can provide a net energy benefit; what is interesting is that the operational negative carbon footprint can be achieved in multiple states using the fenestration specified by the 2019 model code without the need to add a triple pane insulating glass unit (IGU) or any advanced technology. Realizing a fenestration system with negative operational carbon has become more practical with a cleaner electricity source; the dynamics of this will shift for any building using heat pumps rather than natural gas for heating. As expected, there is a relatively strong correlation between the carbon intensity of the grid (Figure 1.2) and the operational carbon of the fenestration (Figure 1.3).
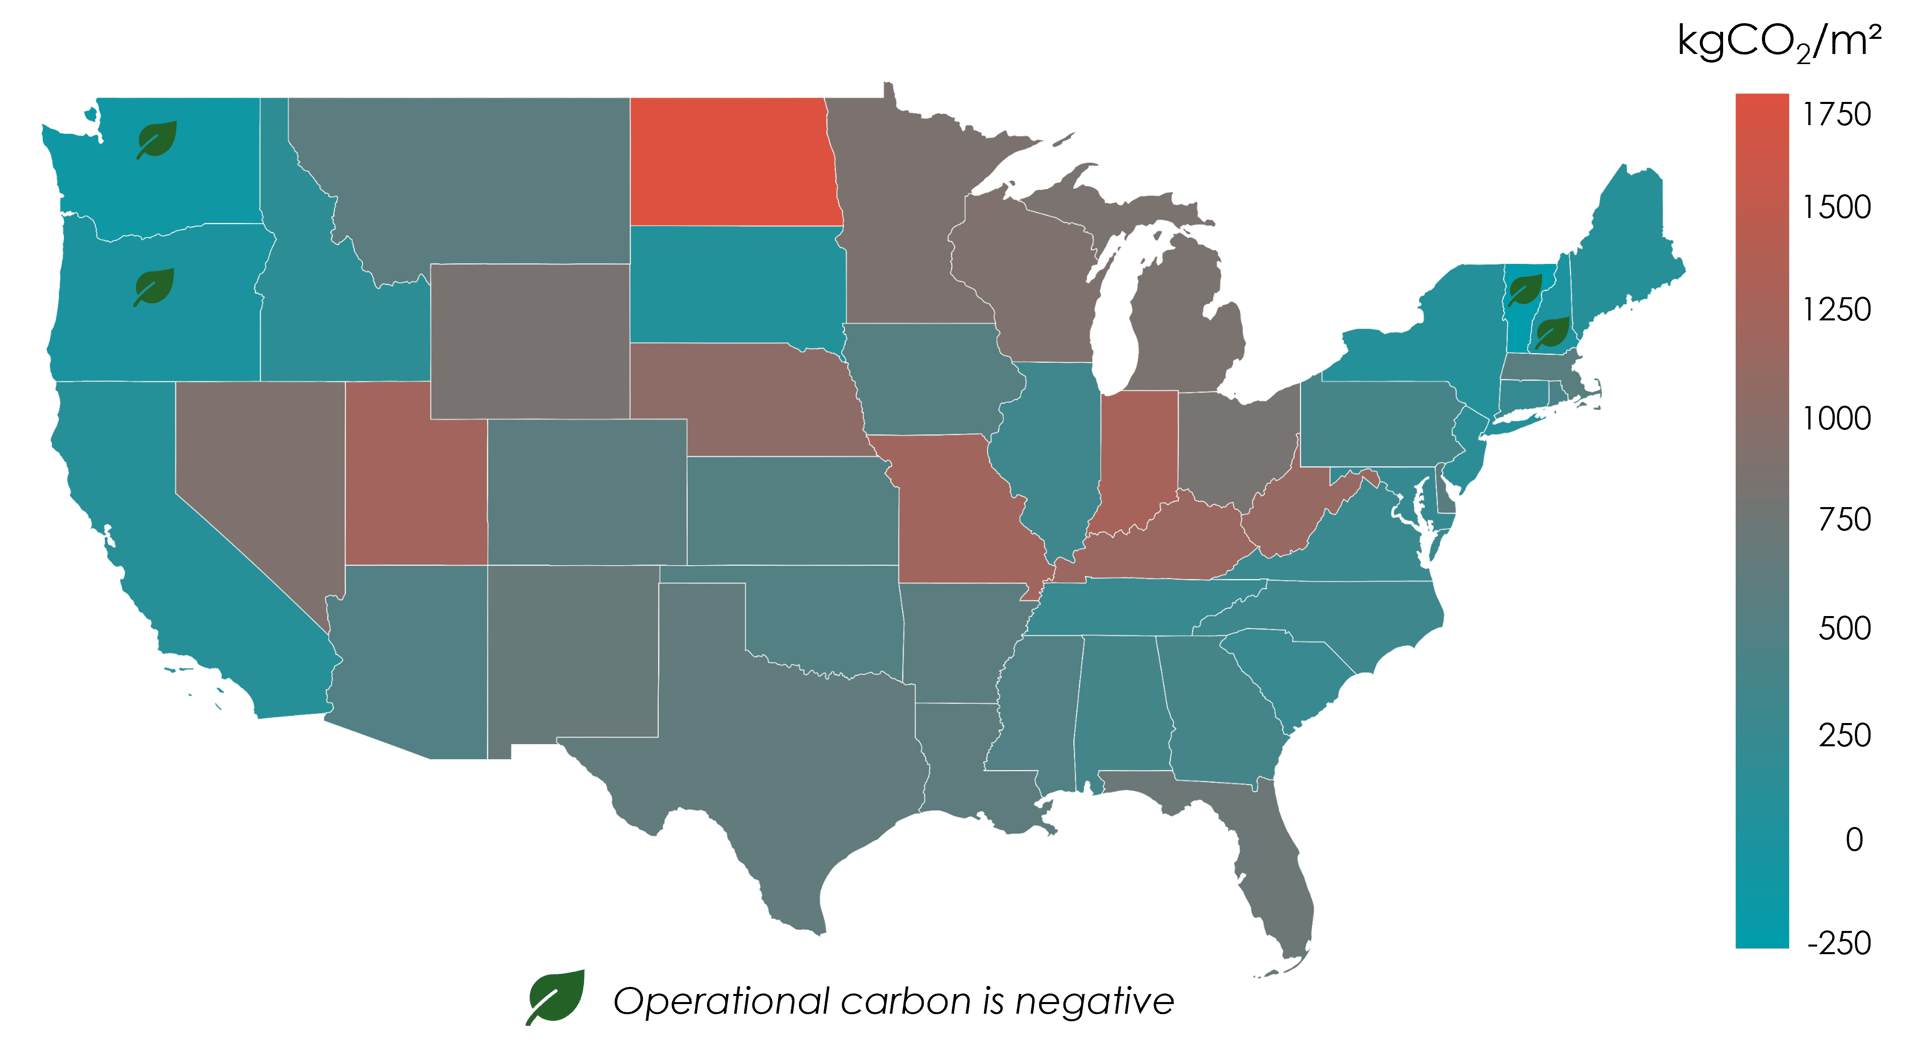
Figure 1.3: Operational carbon footprint of fenestration by state. For each state, one weather file is used along with the model building for the correct climate zone to calculate the energy usage associated with the fenestration system. State average electricity GWP (Figure 1.2) is used to calculate the cumulative carbon footprint assuming a 30-year lifetime. The GWP is normalized by the total building window area (650 m2).
This reinforces the importance of site-specific modeling and utility-specific carbon intensity information when possible. The regions such as the Midwest, with the highest operational carbon represent an opportunity where specifying higher thermal performance fenestration products can have the biggest impact on greenhouse gas emissions reductions. And, as we’ll discuss in the subsequent articles, the U.S. states in the Northeast and West with the lowest operational carbon are regions where embodied carbon can be the main contributor to the carbon footprint of fenestration.
If you would like to evaluate the thermal or visual performance of a fenestration system, click here.